
Dynamic Charts from the View Outputs group allow the user to better visualize various business trends.
Standard bar charts present the trends of Cash Inflows and Outflows, Cash Balance, Cash Balances with Group Companies, Income, Costs and Gross & Net Profit.
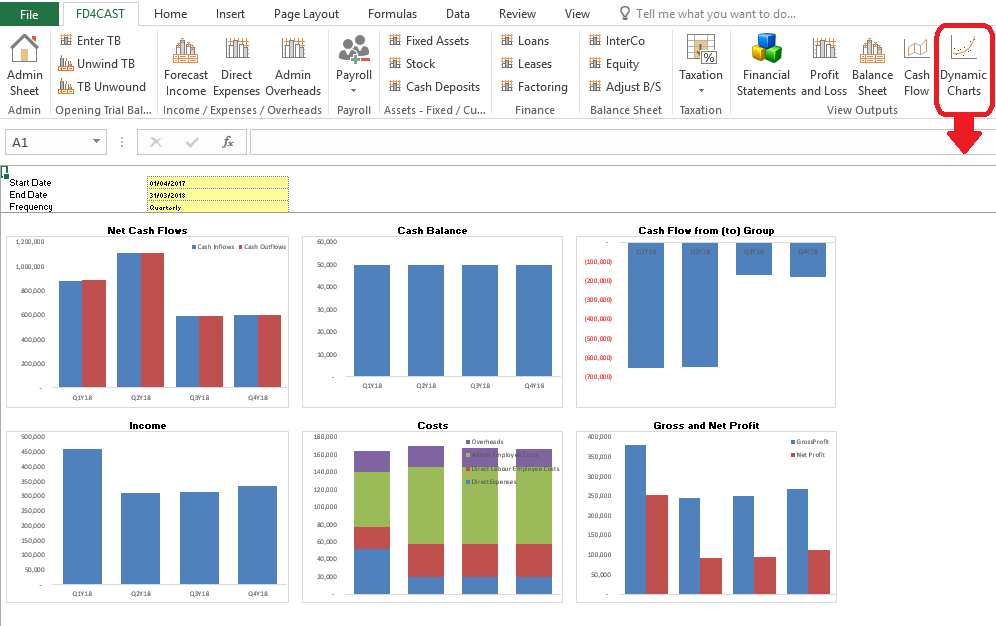
User can easily modify the period covered in charts by changing Start date and End Date in yellow cells from the top of the section.
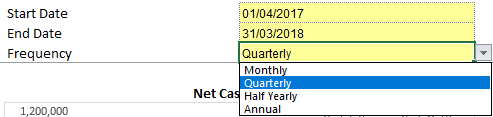
Frequency stands for the period represented by one bar in standard charts. It can be selected from the above drop down list.