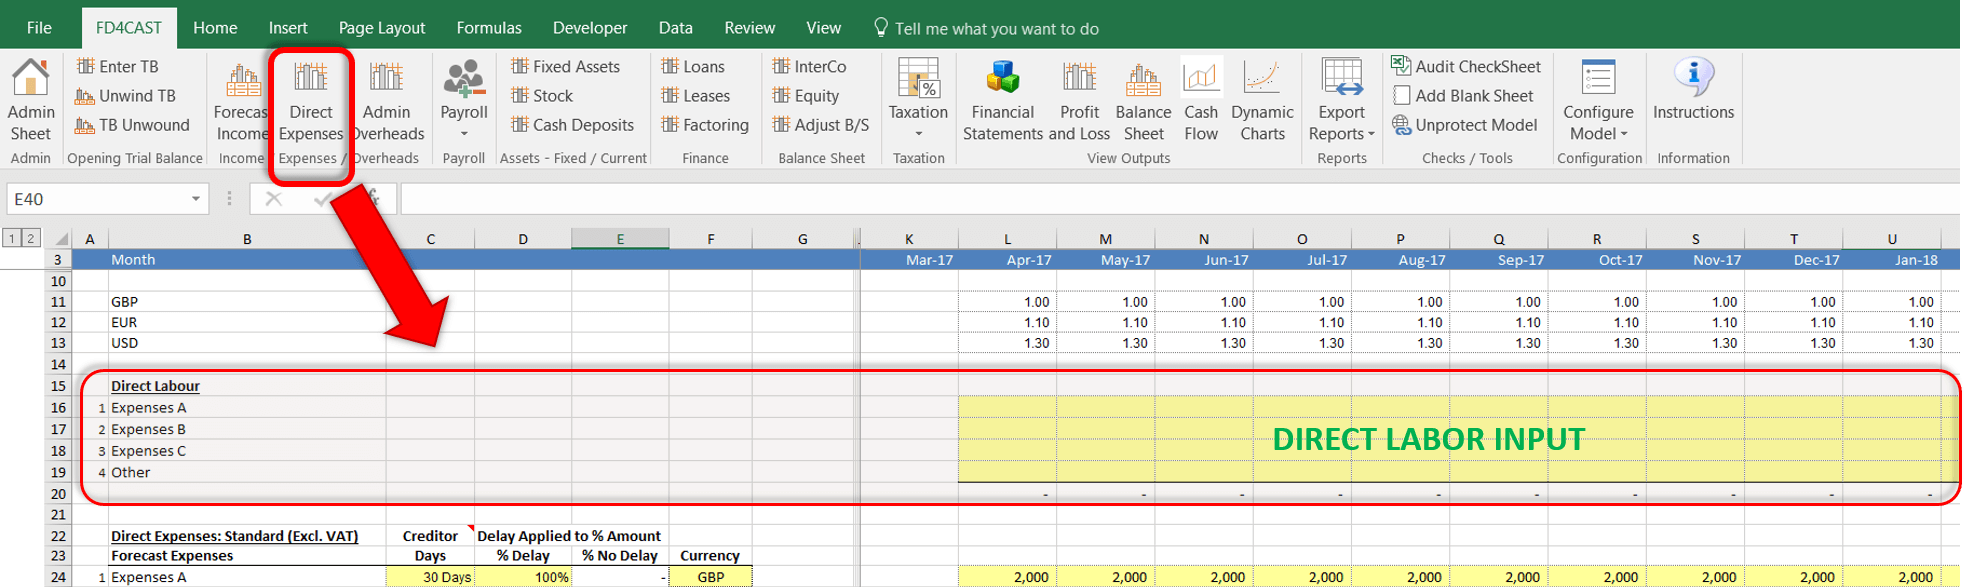
In FD4Cast models, expenses are input in two separate sections: Direct Expenses and Overheads. To be clear on the terminology, Overheads are those costs required to run a business, but which cannot be directly attributed to any specific business activity, product, or service (such as rent, office utility bills, advertisement etc.)
3.3.1 ENTERING STANDARD OVERHEADS
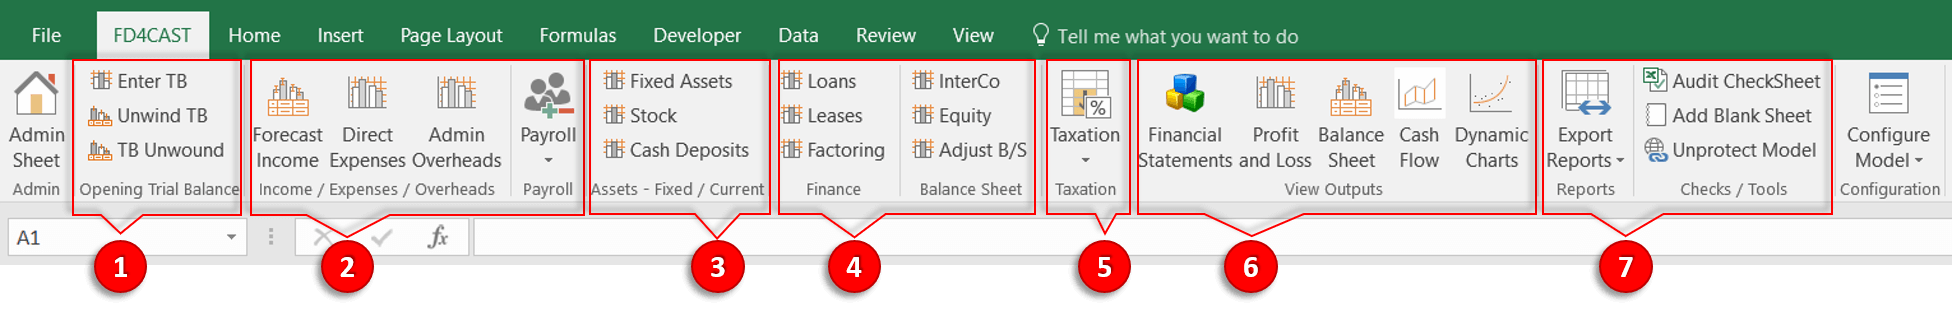
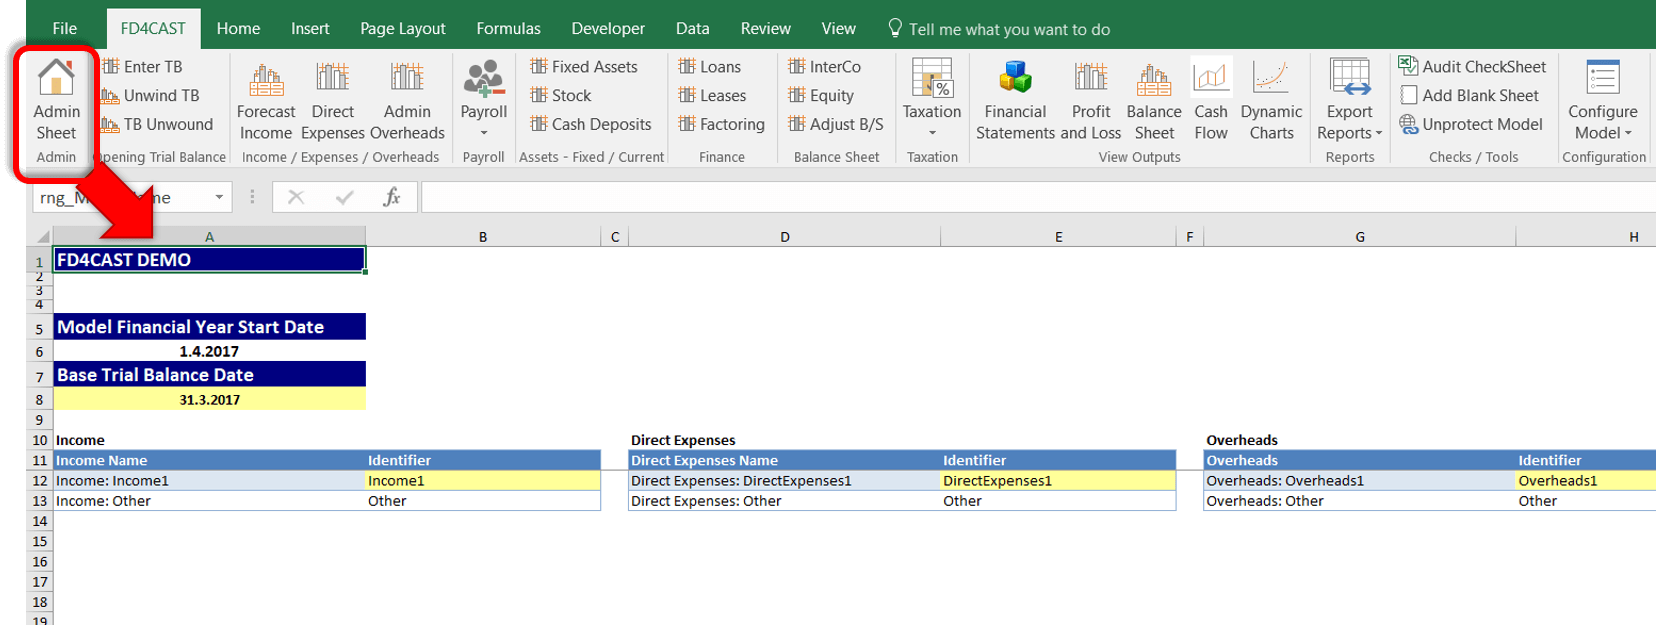
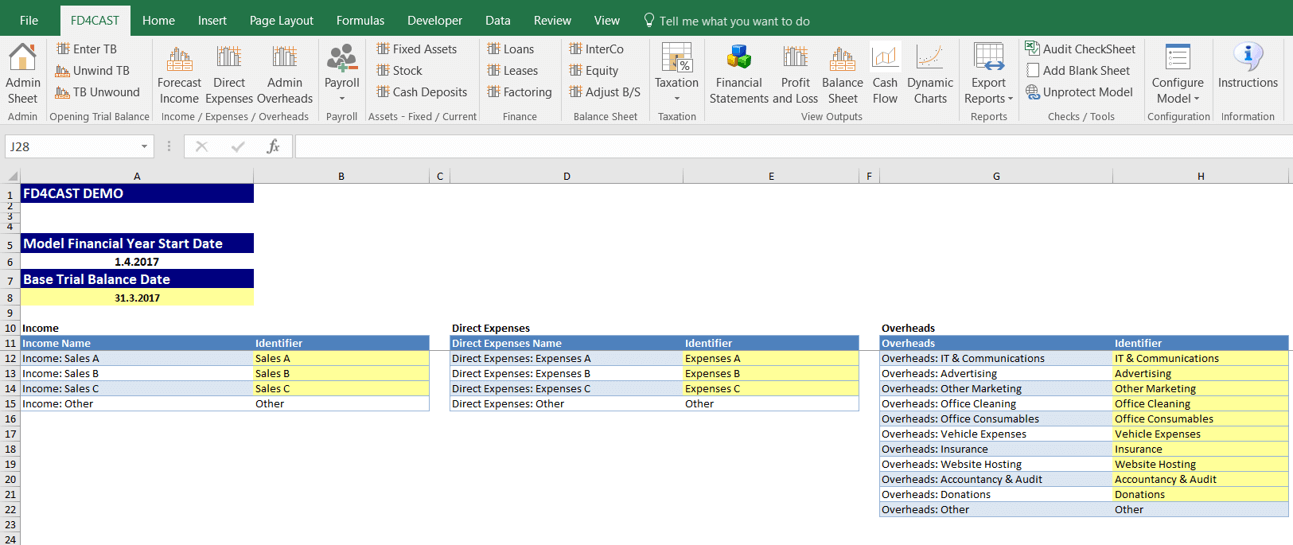
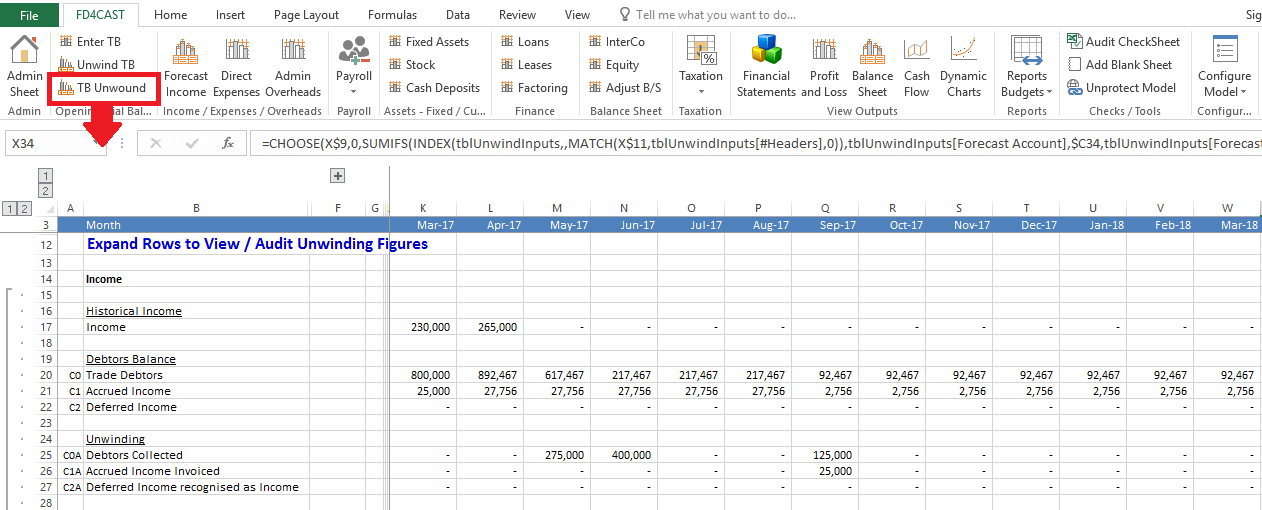
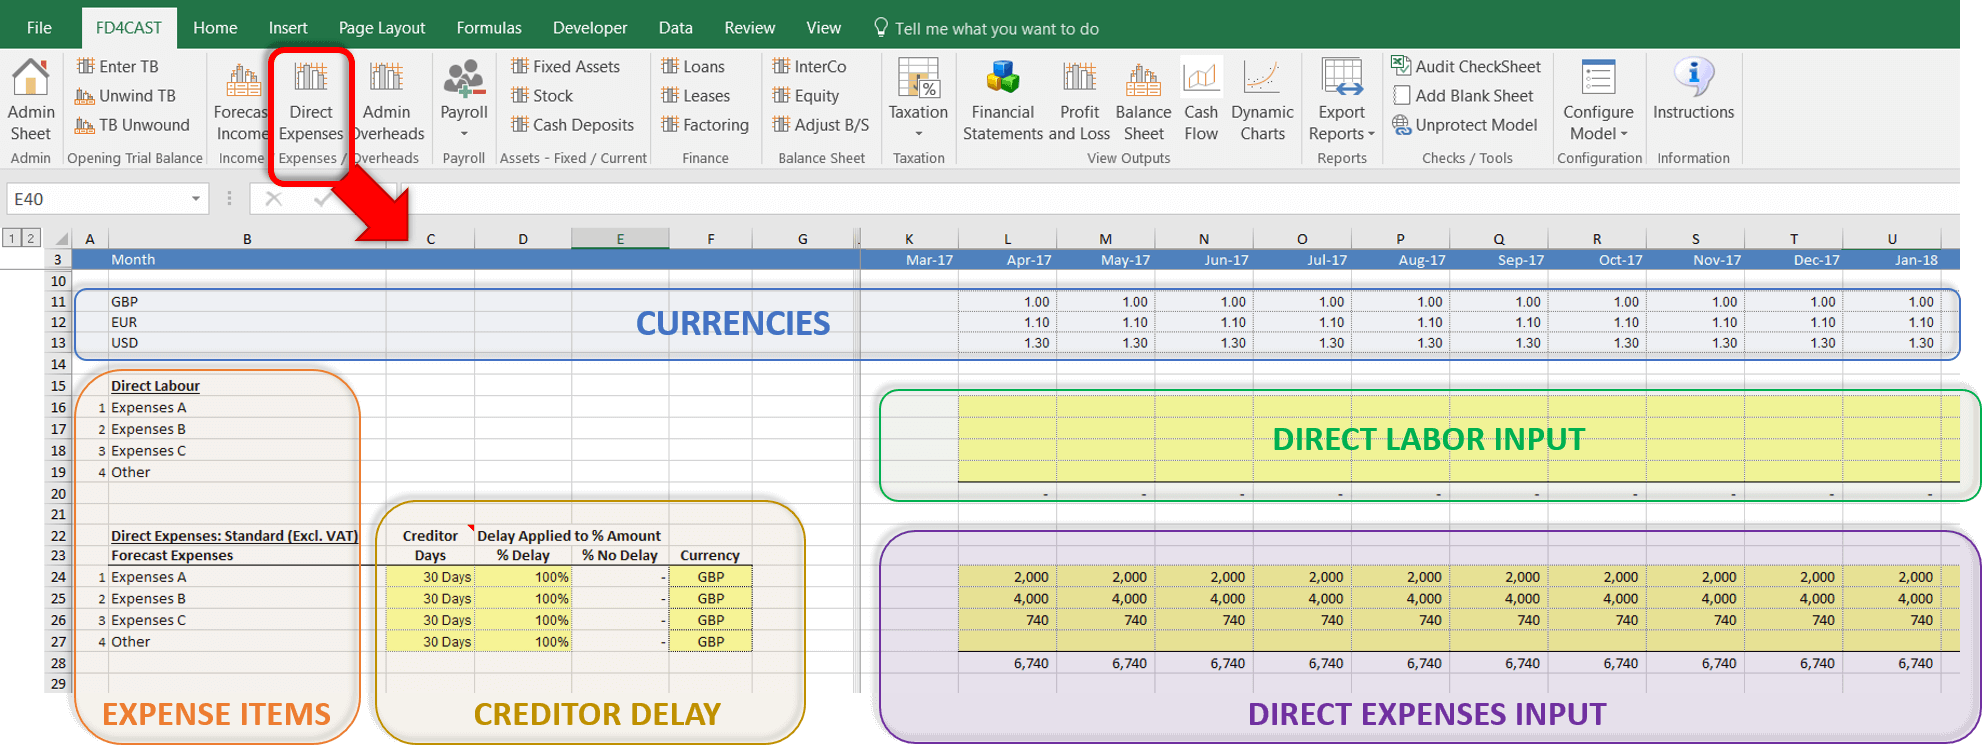
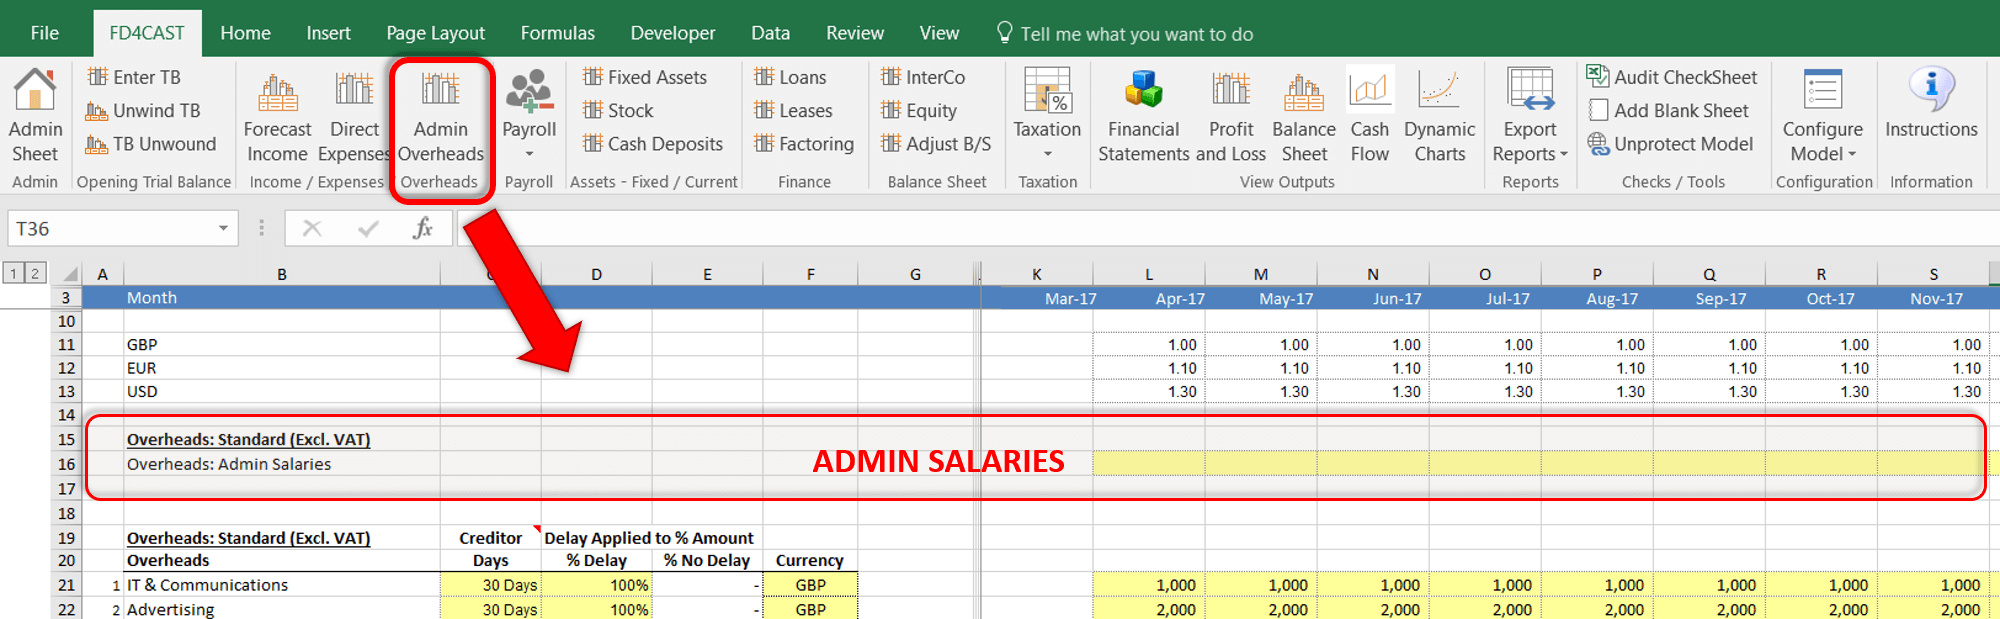
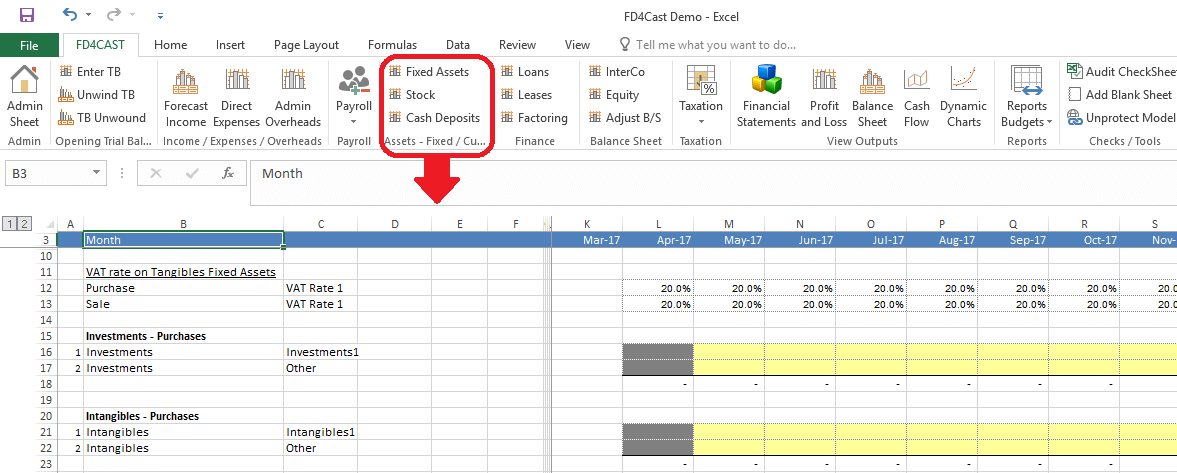
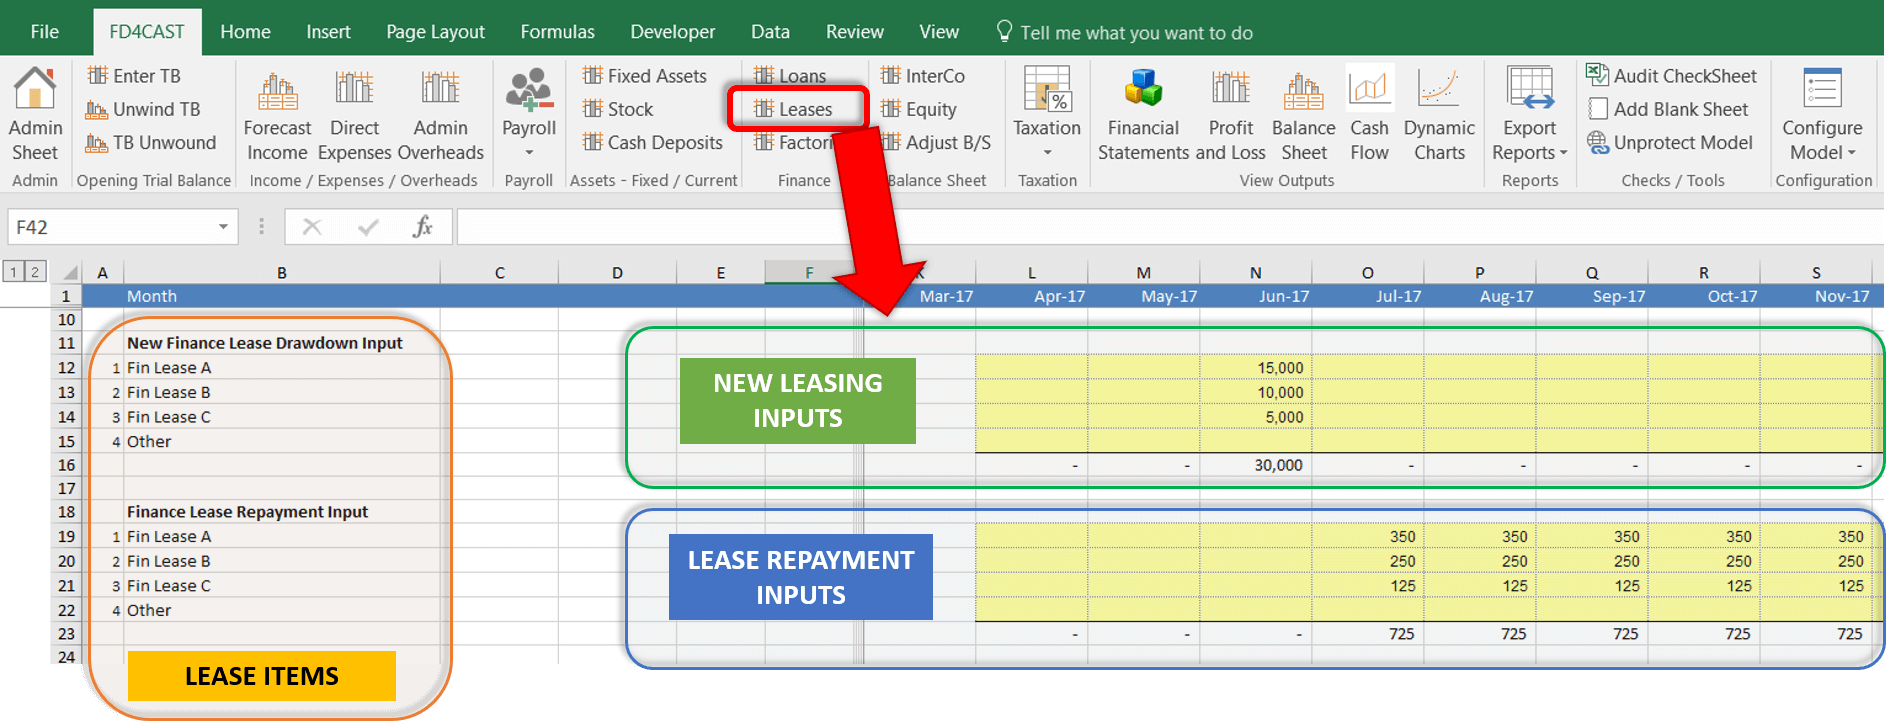
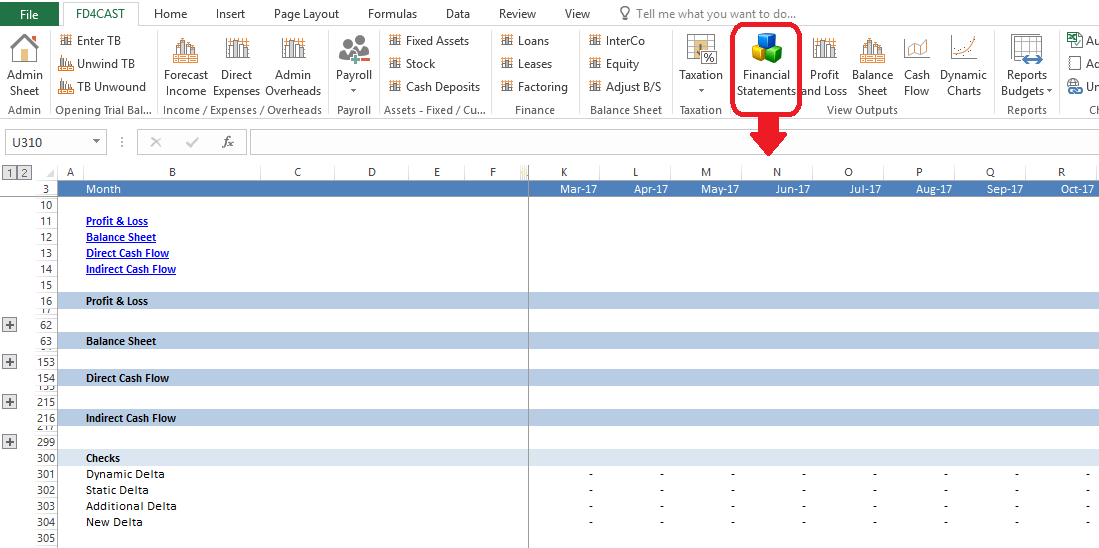
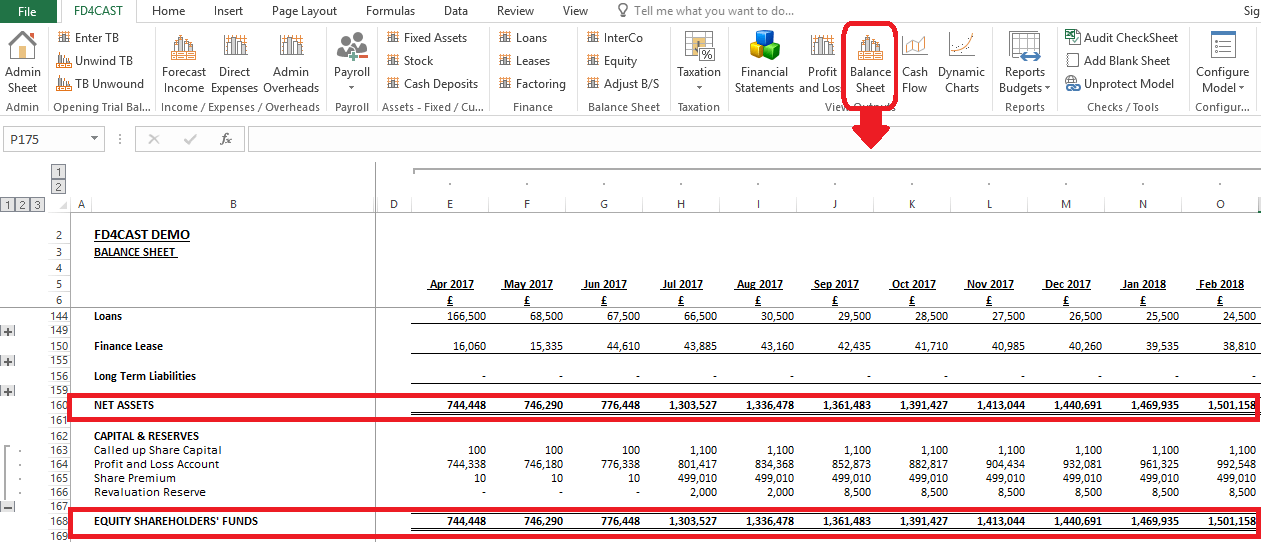
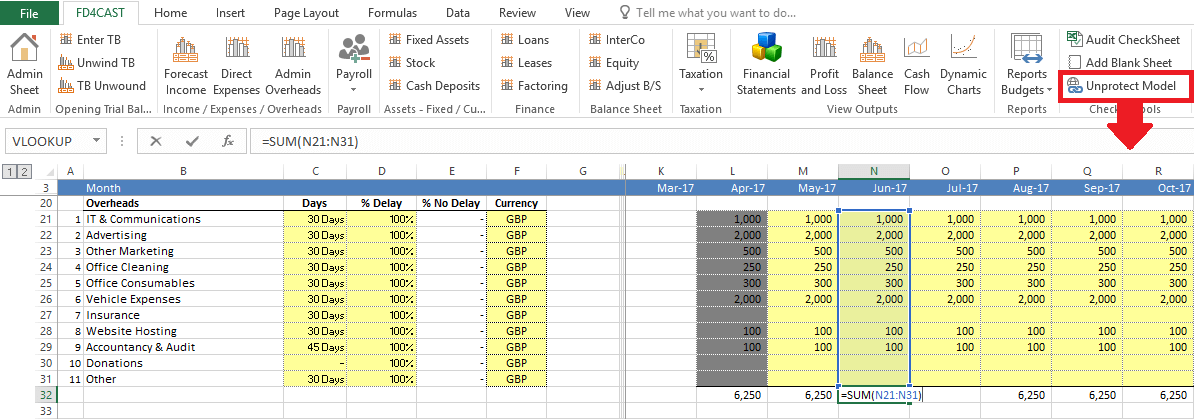
Overheads can be added into the model by clicking on ‘Admin Overheads’ on the FD4Cast ribbon, as shown below:
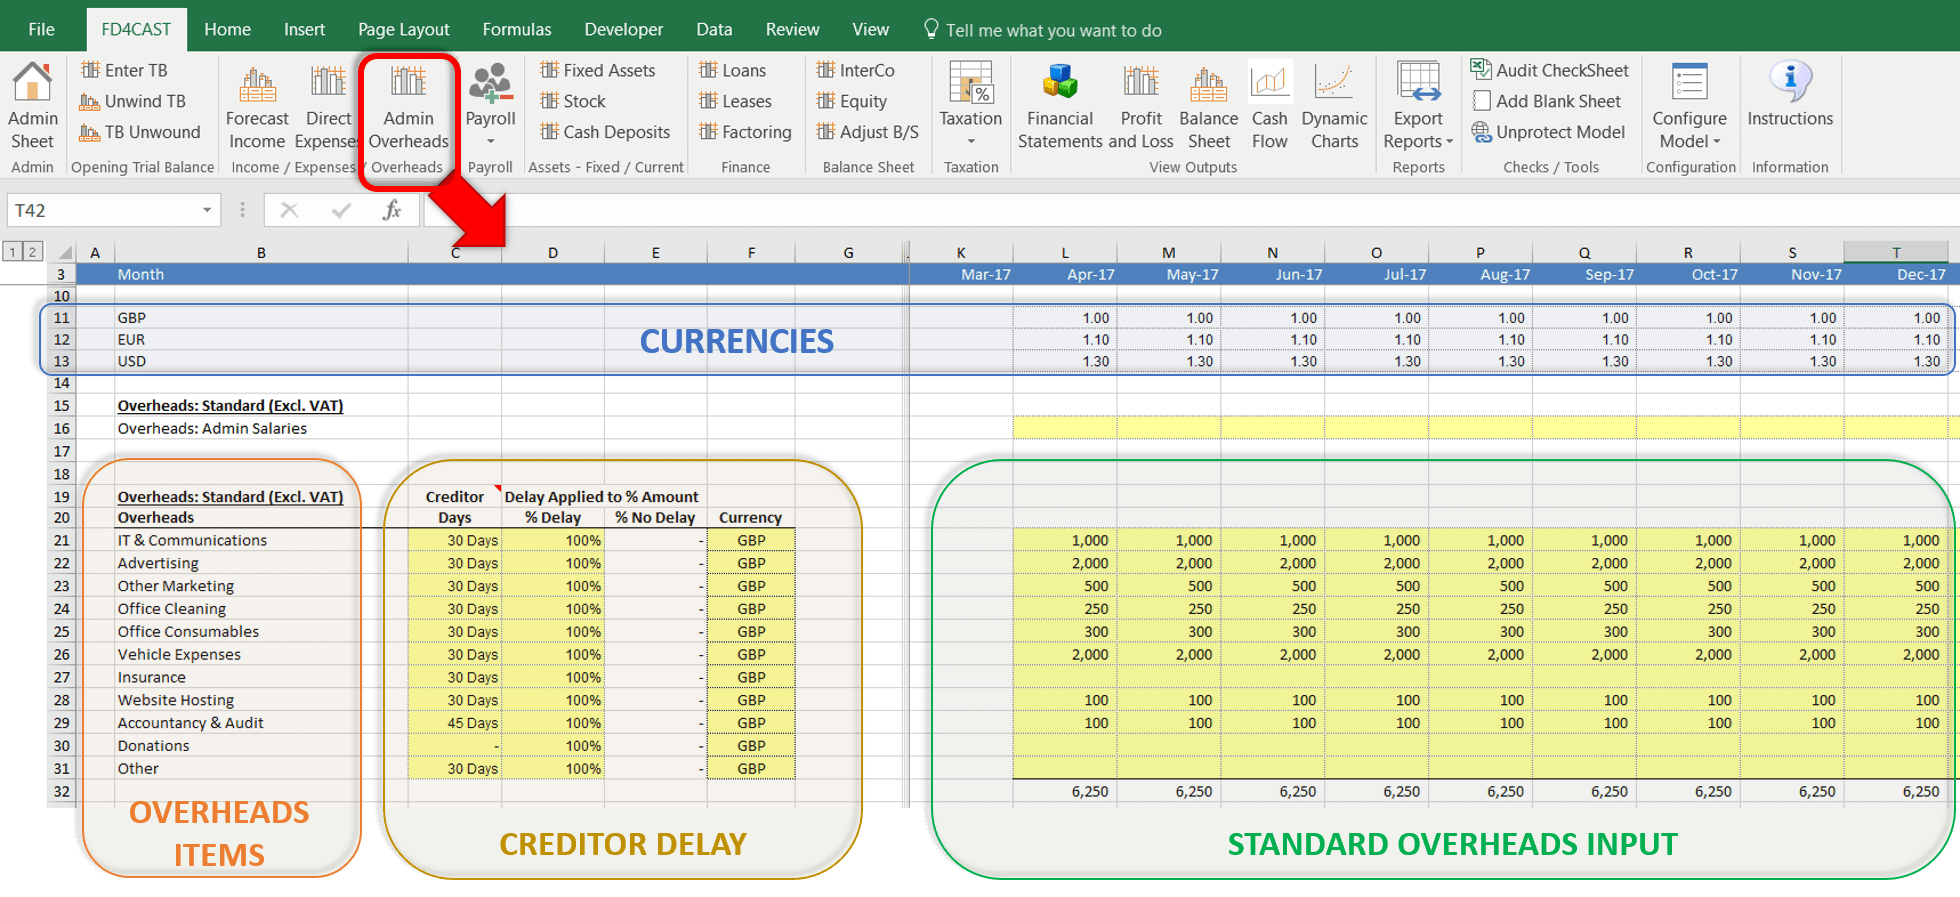
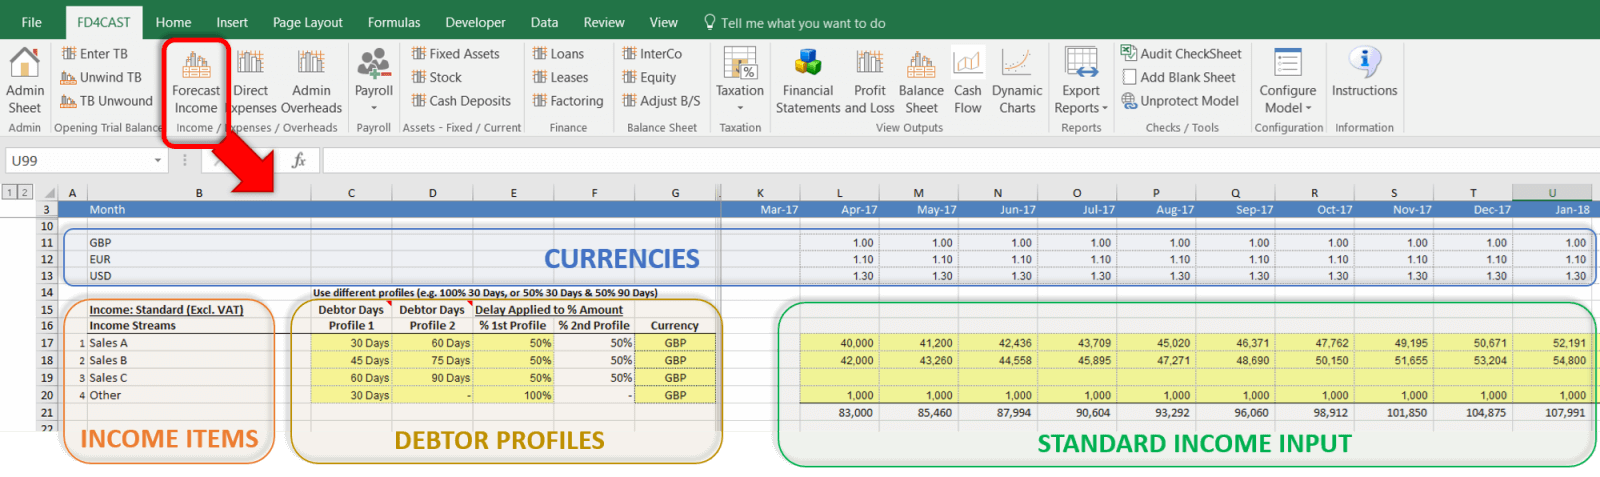
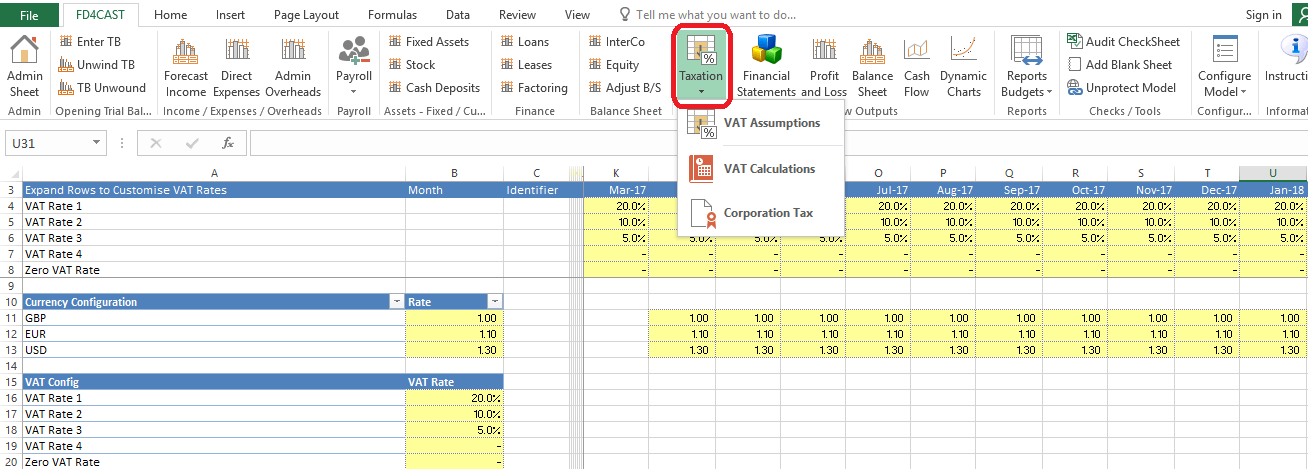
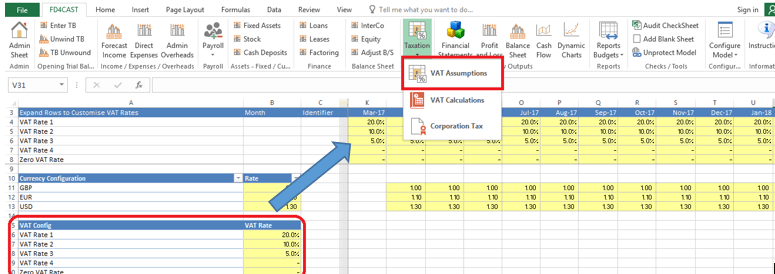
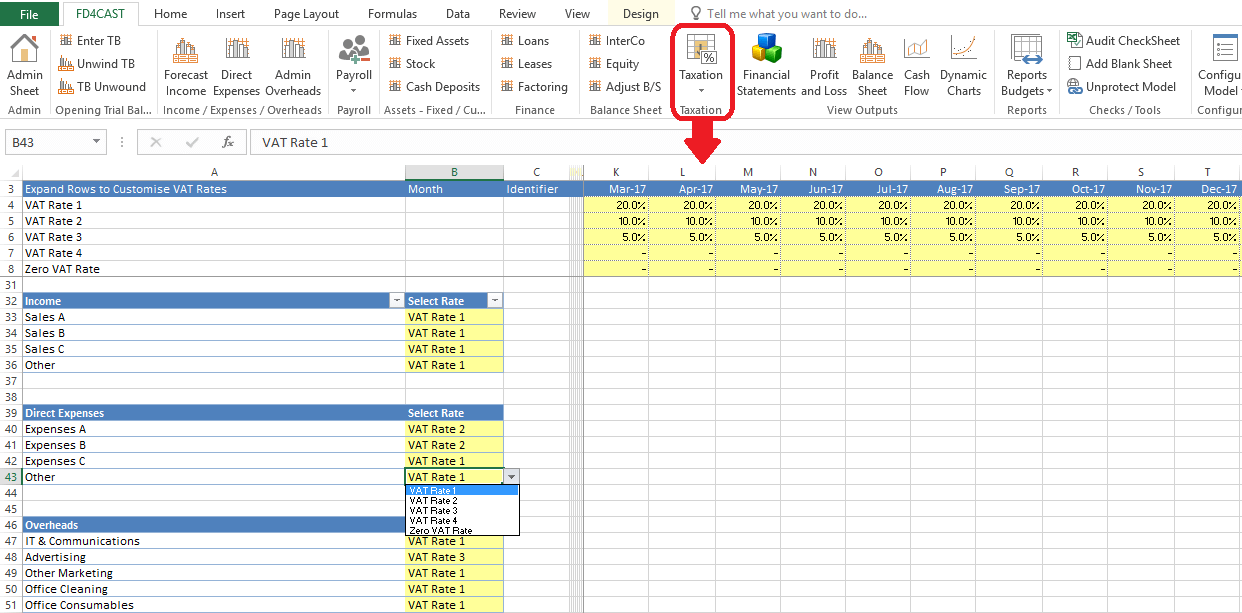
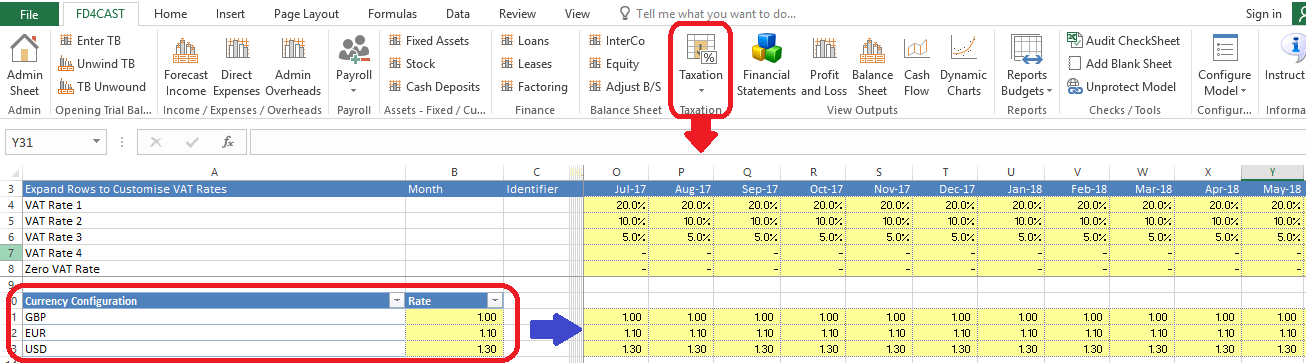
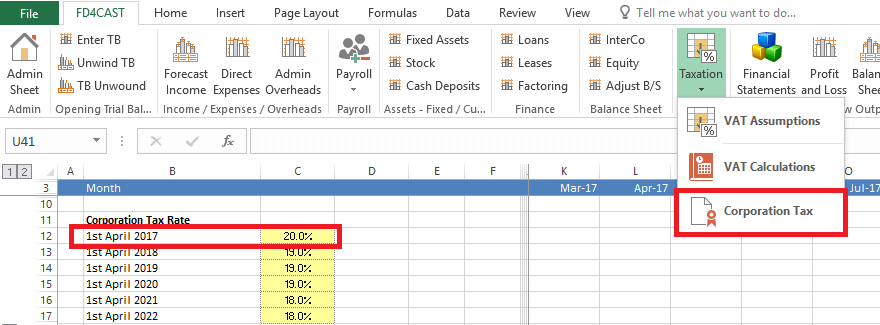
Currencies: At the top of the screen (blue region) you will see the currency ratios for each month. This section is managed from Taxation > VAT Assumptions from the model ribbon. Different currency ratios can be input for the following months for more accurate forecasts. (For more details, see: 6.1 VAT & CURRENCY ASSUMPTIONS)
Admin Salaries: This input area (just below currencies region) is being used for admin salaries. (This is another way of inputting admin salaries if users don’t want to use the Payroll Input sheet to enter employees individually. This is explained in more detail in section 3.4 Payroll Management)
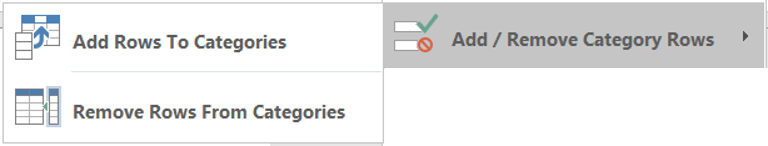
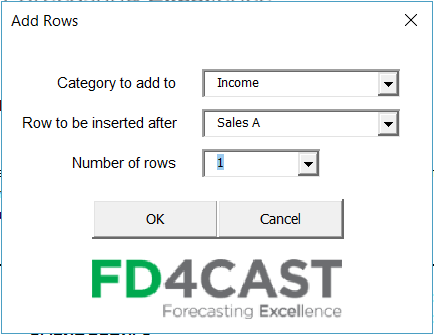
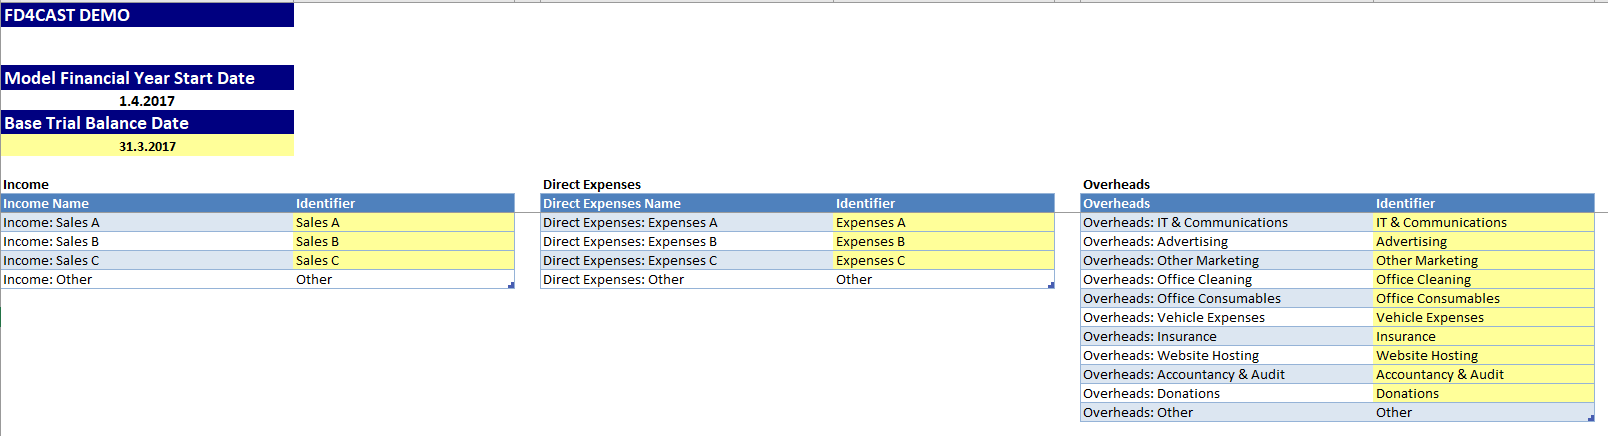
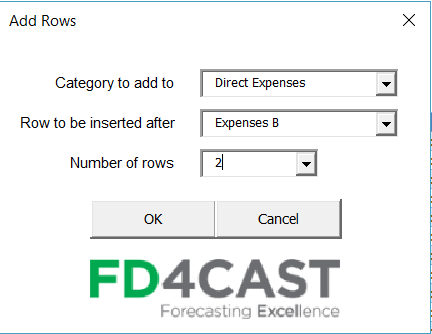
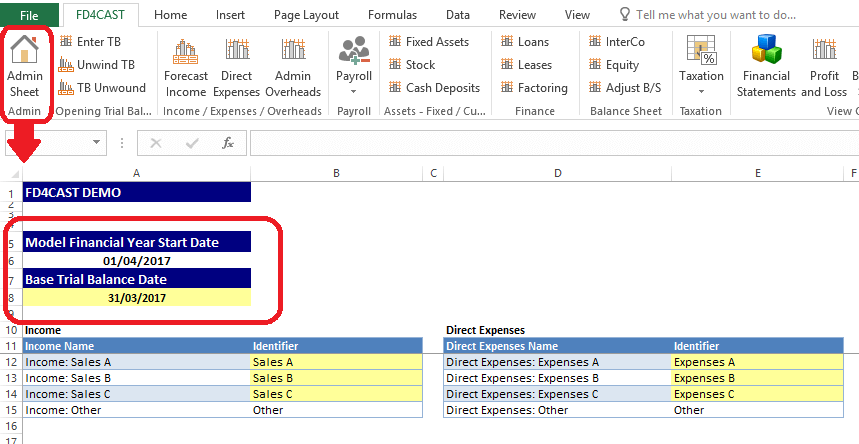
Overheads Items: On the left hand side of the screen (orange region) we see different overheads items. These belong to the Overheads category which can be added as shown at 1.4.2 Add/Remove Category Rows and renamed as shown at 1.5 Admin Sheet.
Creditor Delay: In this section in the middle (yellow region) we can manage the relation between payments and time delays. This is explained under direct expenses, 3.2.2 How to Use Creditor Delay Section?
Standard Overheads Input: This is the section (green region) where overheads for each category and each month can be entered manually. Overheads forecasts should be entered net of VAT and in the month that the income is invoiced. Any timing differences for prepaid/accrued overheads are dealt separately and explained in detail below.
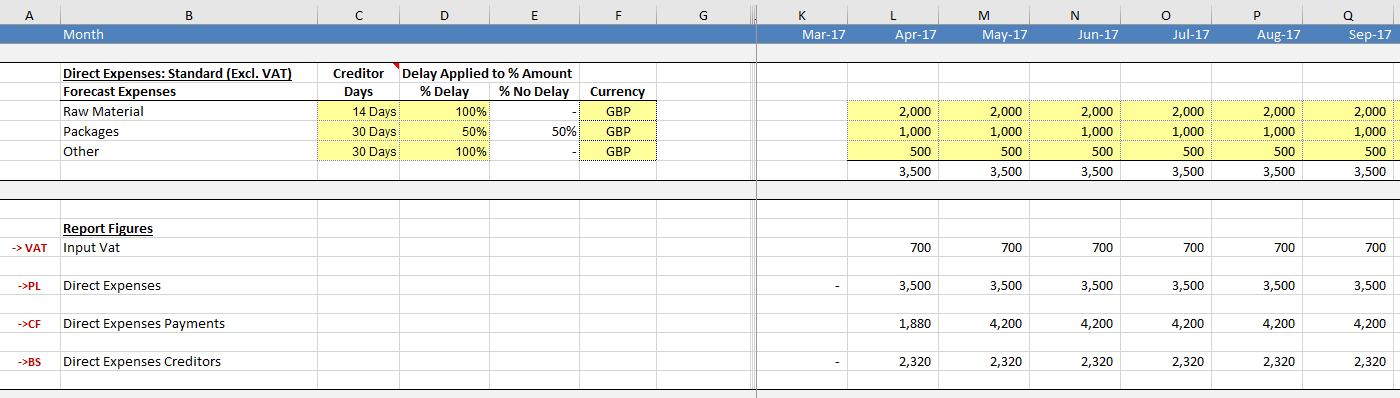
Once you have input your overheads forecasts, you will see various tables below your forecasts. These tables are for audit purposes only, and cannot be edited. They allow you to see the figures flowing correctly through your model and the effect they have on other parts of the FD4Cast model. Other tables here will be dependent on your creditor profiles and timing assumptions (Prepaid/Accrued Overheads).
3.3.2 PREPAID OVERHEADS
Some overheads are not paid monthly but paid upfront for a certain period. For instance, if a company had paid for a whole year’s worth of insurance upfront, the amount paid would be an asset of company that can be recorded as a prepaid overhead. The company can then reverse the associated monthly cost.
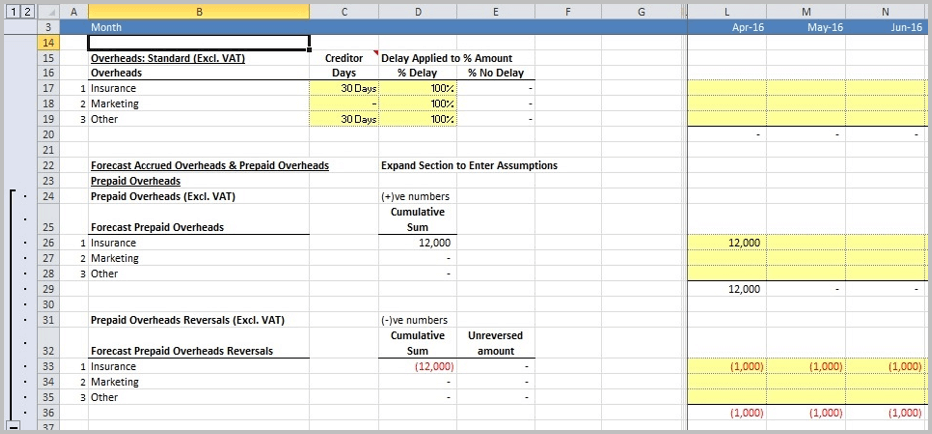
In the example below ‘Insurance’ has a prepaid overhead of £12,000 entered in April 2016, representing the upfront payment of insurance for the year ahead. The reversal of the prepaid overhead is then entered over the period that it relates to, in this case it is -£1,000 over the 12 months from April 2016 to March 2017.
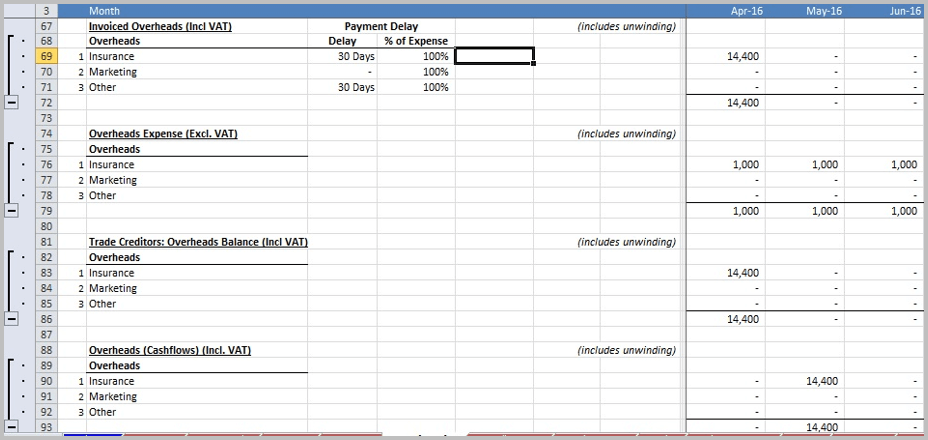
The model calculates the VAT (20% = £2,400) on the £12,000 prepayment for ‘Insurance’ and enters £14,400 in Invoiced Overheads (Incl. VAT) and Trade Creditors: Overheads Balance (Incl VAT) in April 2016.
As Insurance has a payment delay of 30 days, the model shows the £14,400 being paid in May 2016.
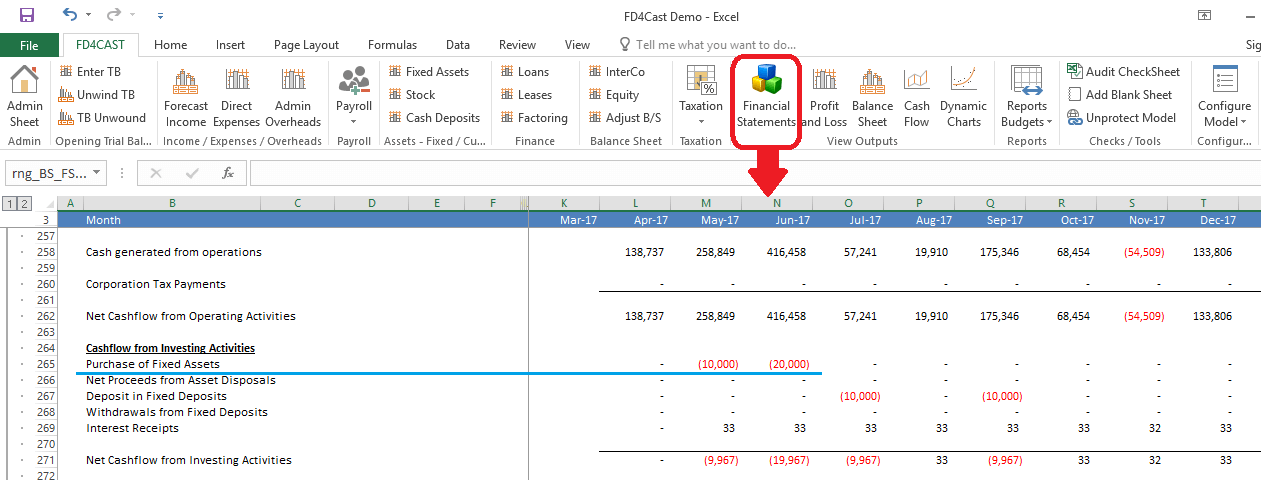
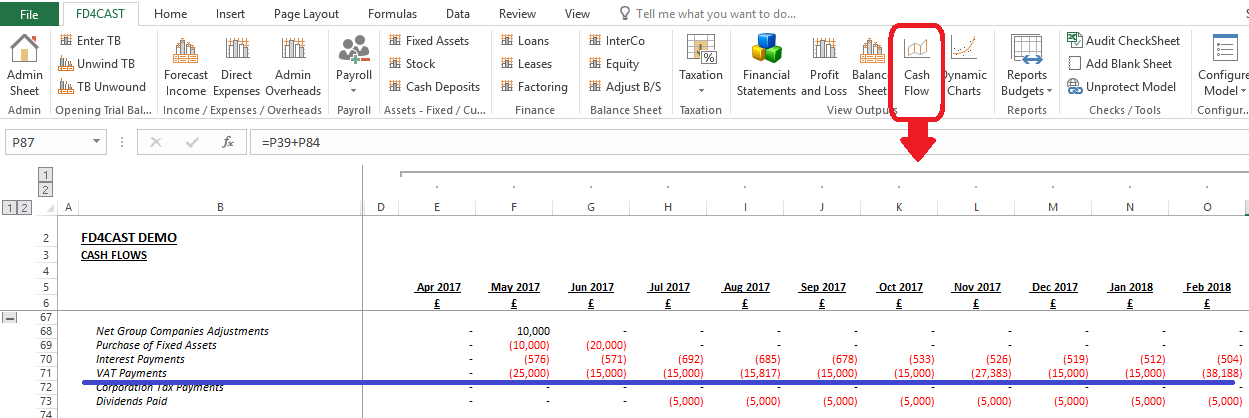
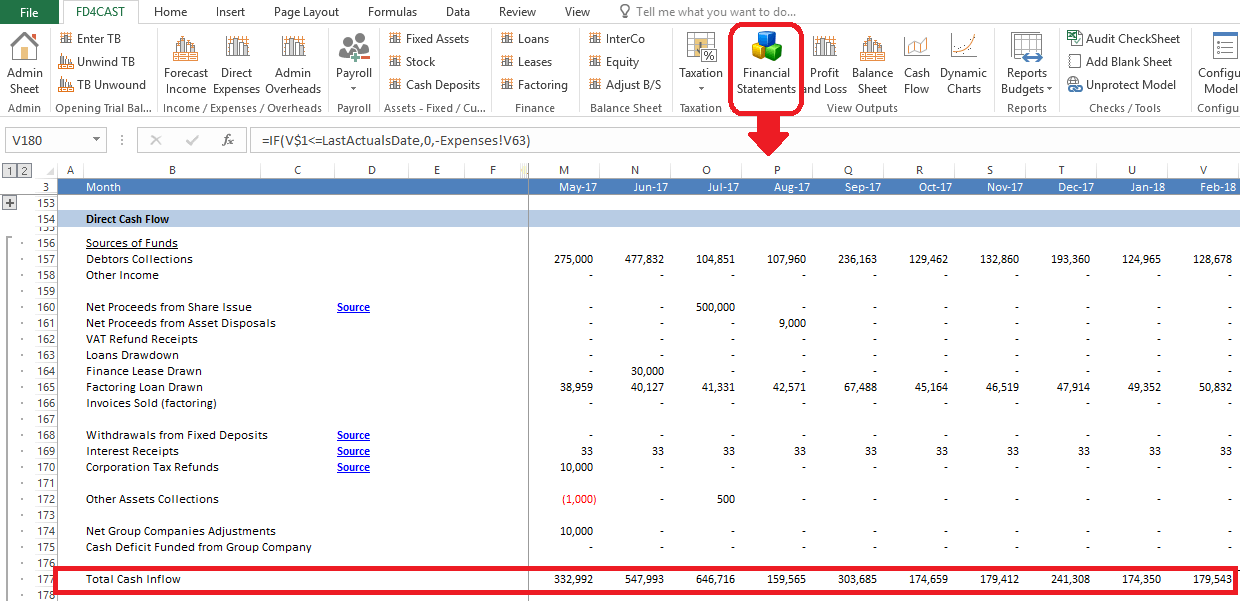
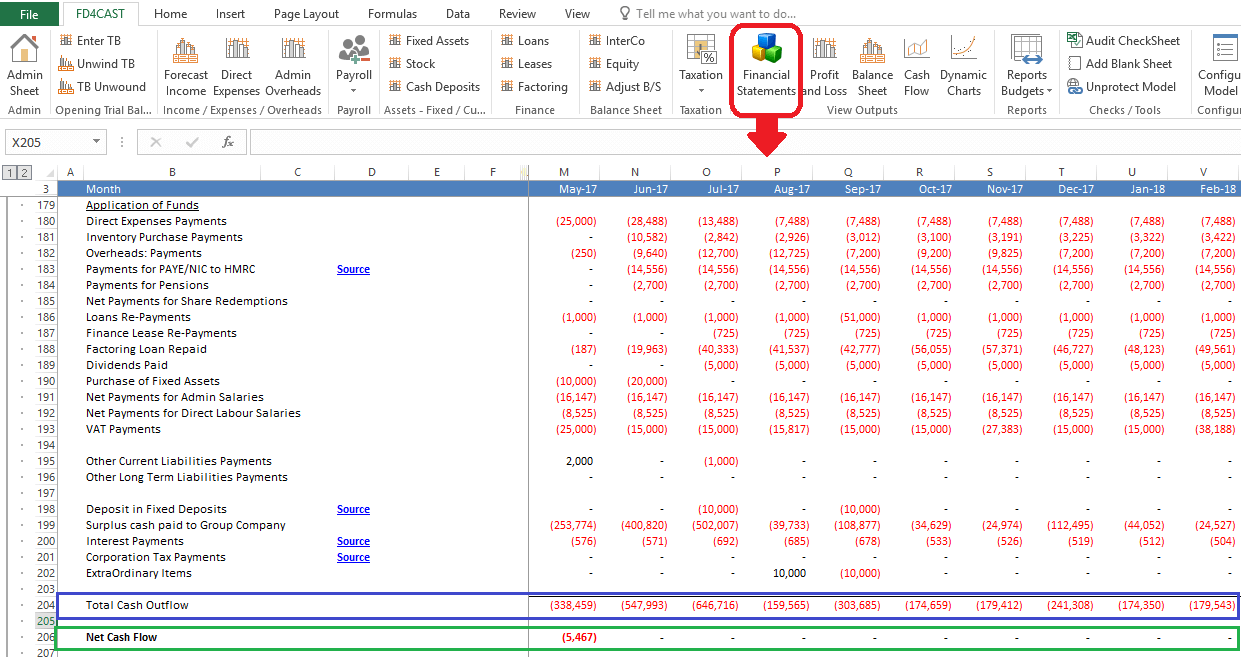
Prepaid Overheads – Impact on Direct Cash Flow
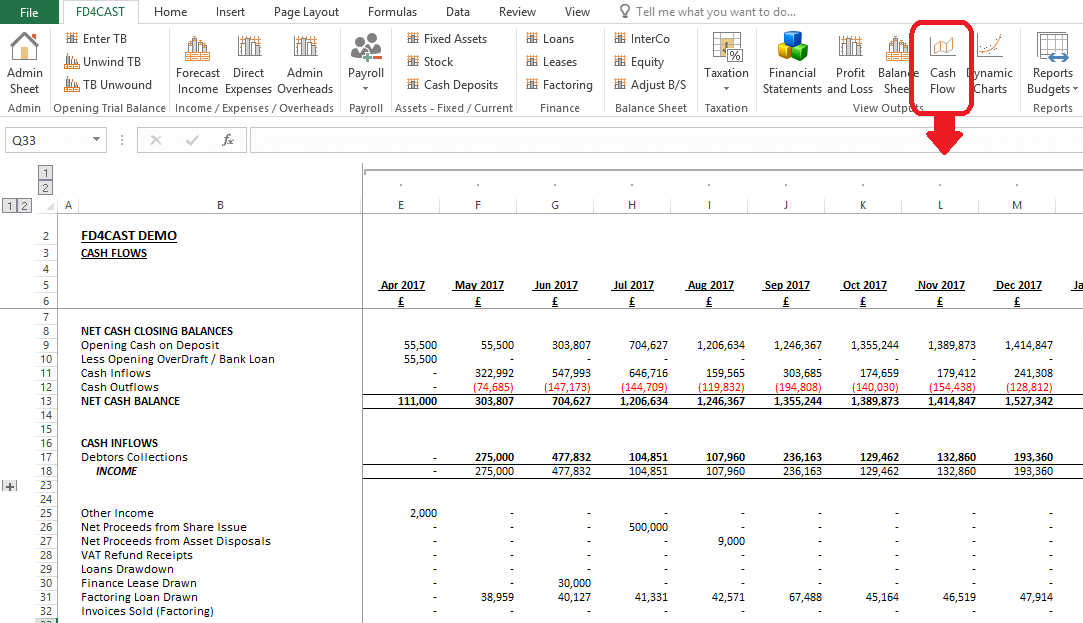
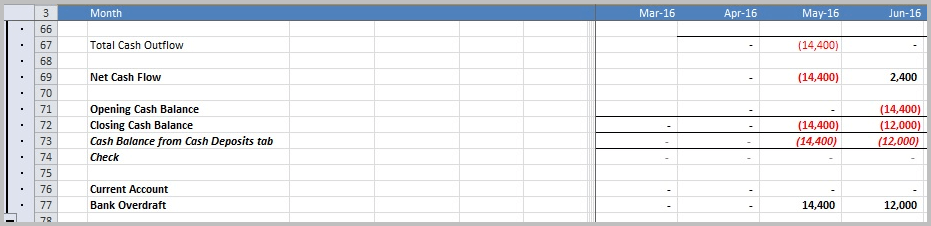
On the Financial Statements worksheet the model reflects the impact on the company’s cash flow. The Total Cash Flow for May 2016 is -£14,400 reflecting the settling of the invoice for the Insurance prepayment. The Opening Balance is £0, Closing Balance -£14,400 and Bank Overdraft of £14,400.
In June 2016 the company’s VAT Refund Receipts means it has a Total Cash Inflow and Net Cash Flow of £2,400. The Opening Cash Balance is £14,400, Closing Cash Balance is £12,000 and Bank Overdraft now £12,000.
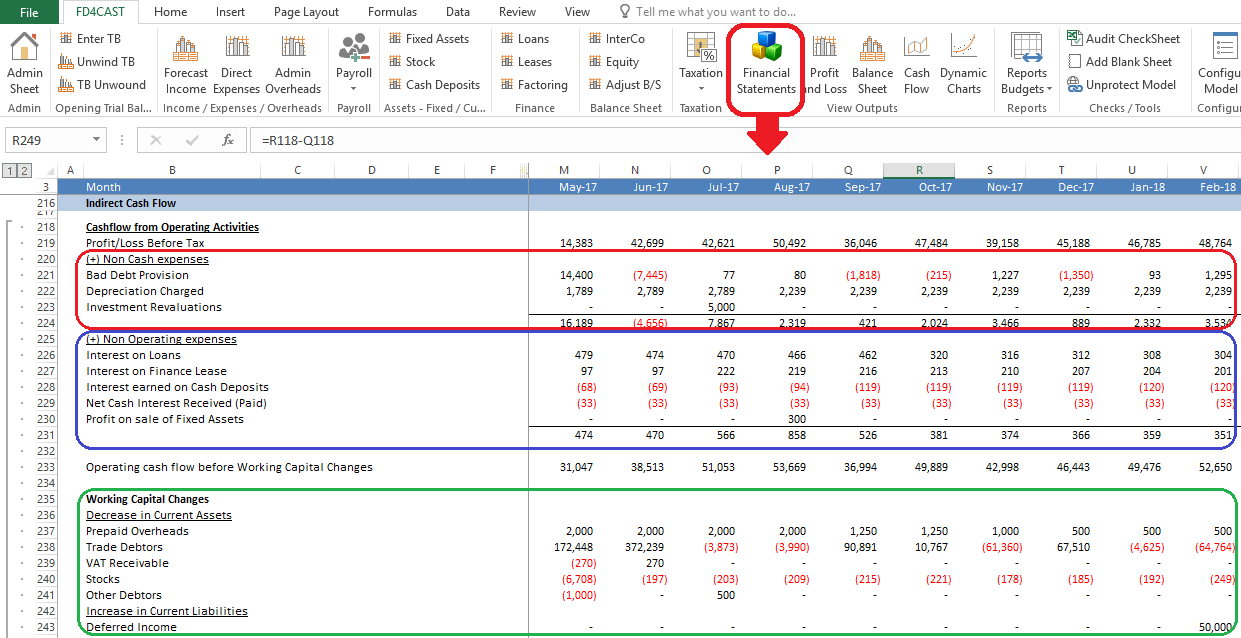
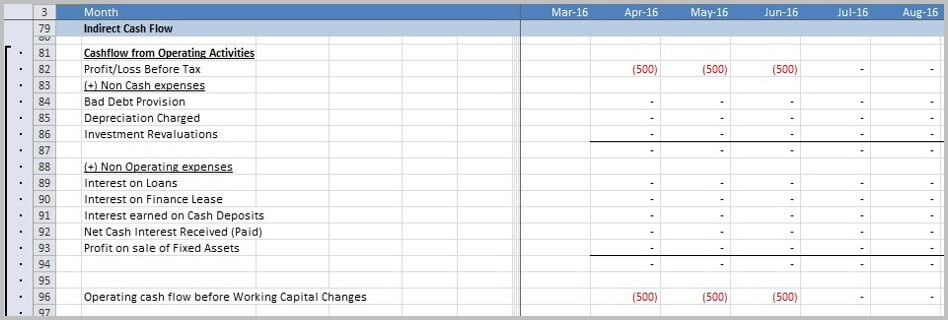
Prepaid Overheads – Impact on Indirect Cash Flow
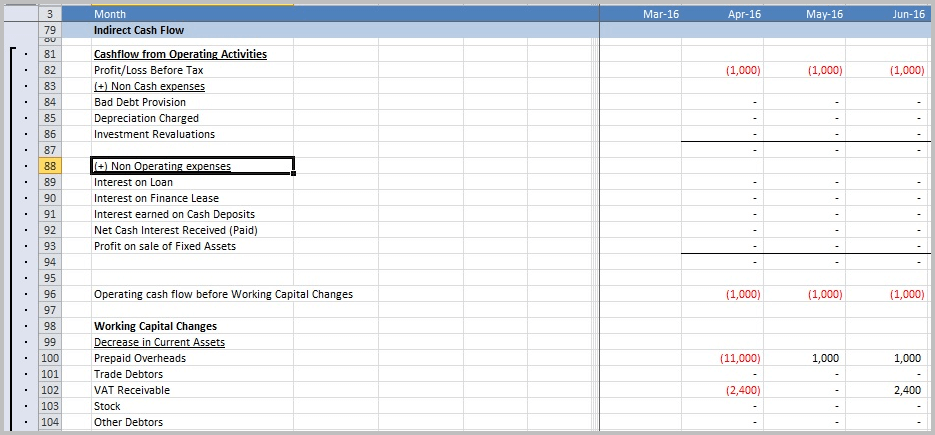
The prepaid reversal of £1,000 for the 12 months that the prepayment covers is shown as a negative figure in Profit/Loss Before Tax and Operating cash flow before Working Capital Changes.
The Prepaid Overheads of £11,000 in April 2016 shows the difference between the -£12,000 Insurance prepayment and the £1,000 reversal reflecting the Insurance cover for April 2016 only. In the months April 2016 to June 2016 there is £1,000 reversal reflecting the Insurance cover for each month.
VAT Receivables shows the VAT of -£2,400 included on the invoice and then the £2,400 VAT Refund Receipts received in June 2016.
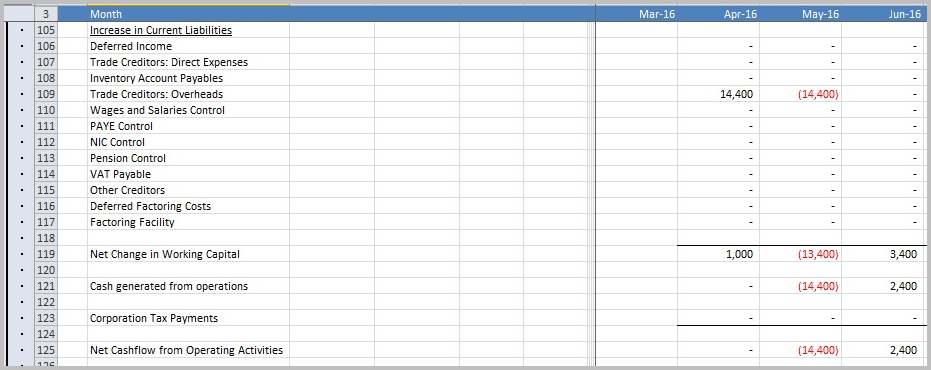
The Trade Creditor: Overheads in April 2016 shows the £14,400 relating to the unpaid invoice and then in May 2016 -£14,400 as the invoice is paid in the month.
The Net Change in Working Capital for April 2016 is £1,000 showing the difference between the Prepaid Overheads -£11,000, VAT Receivables -£2,400 and Trade Creditors: Overheads £14,400.
The Net Change in Working Capital for May 2016 is -£13,400 showing the difference between the Prepaid Overheads £1,000 and Trade Creditors: Overheads -£14,400.
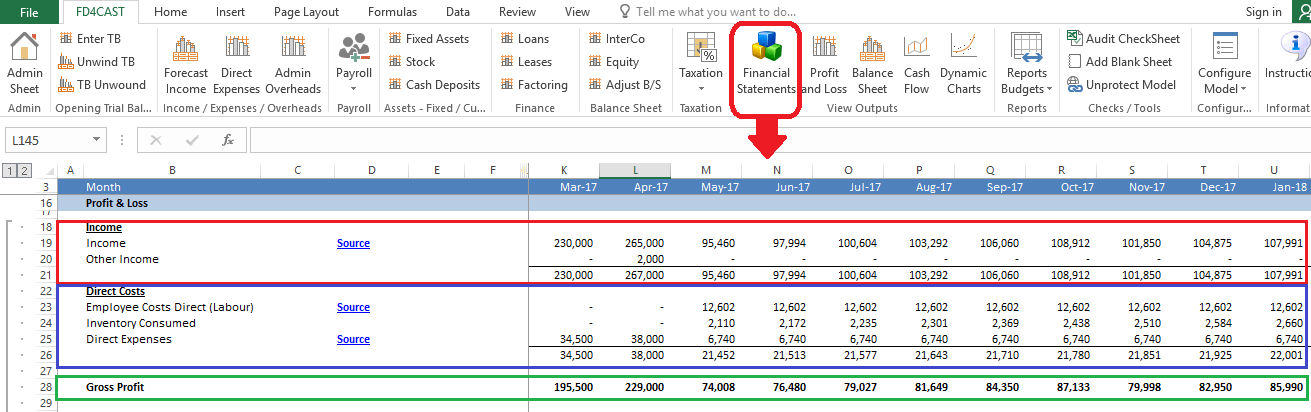
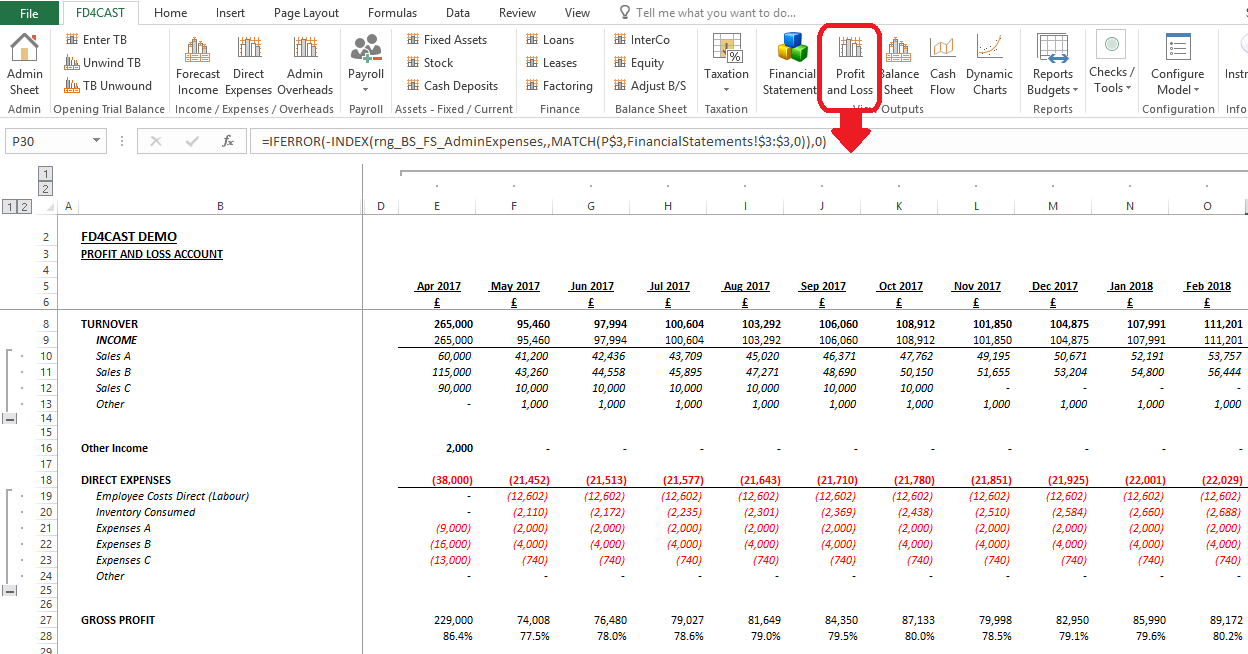
Prepaid Overheads – Impact on Profit and Loss
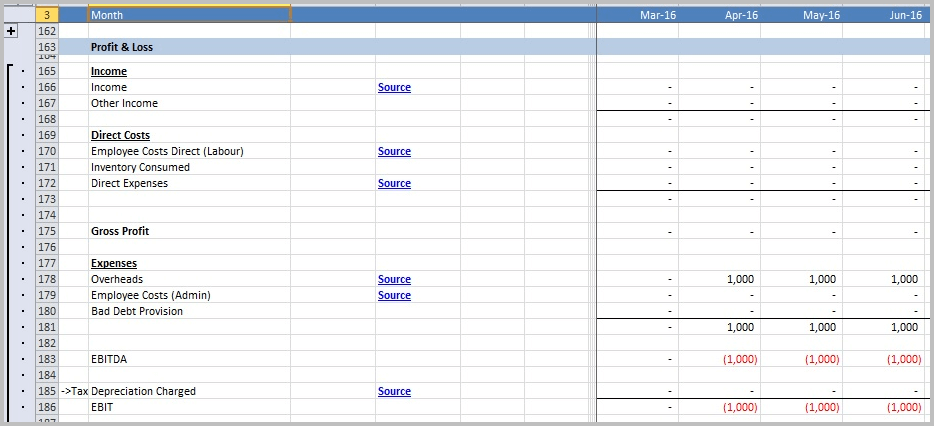
The reversal of the prepaid overhead is shown under Expenses over the period that it relates to, in this case it is £1,000 over the 12 months from April 2016 to March 2017.
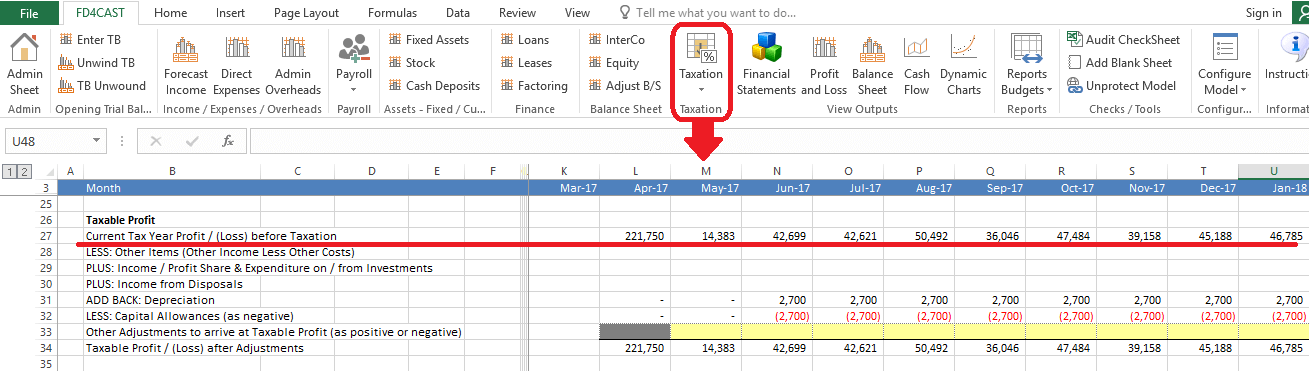
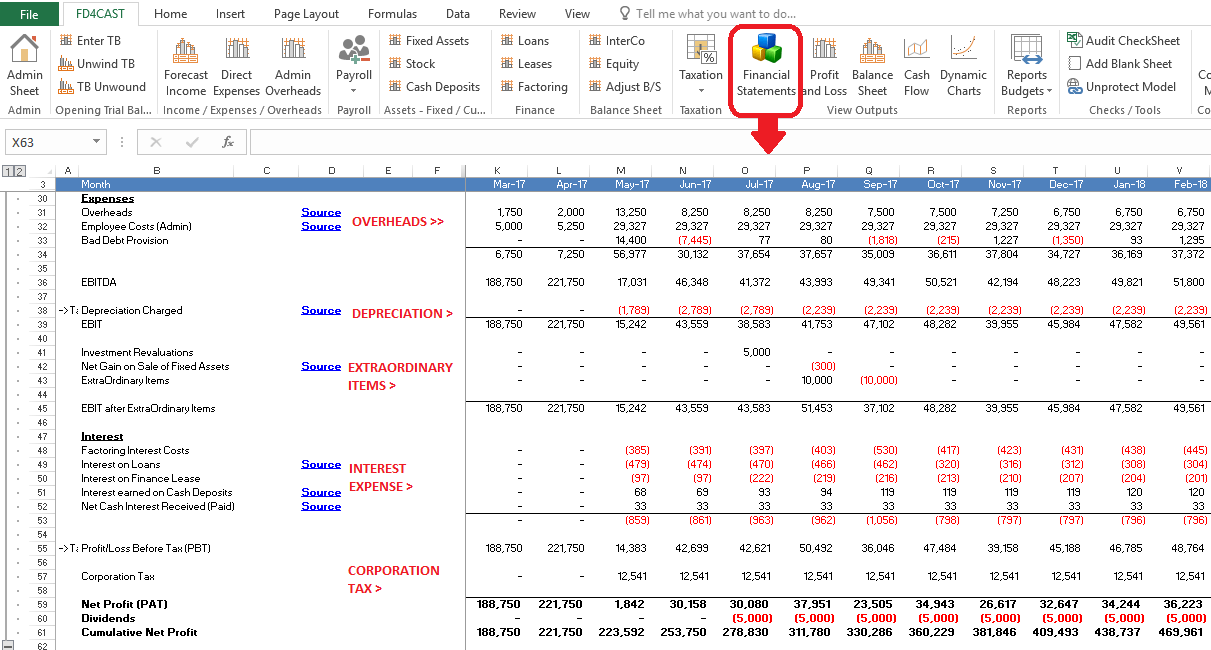
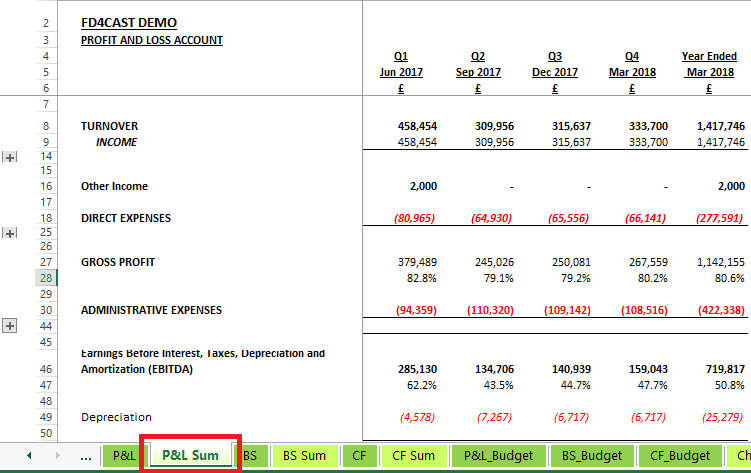
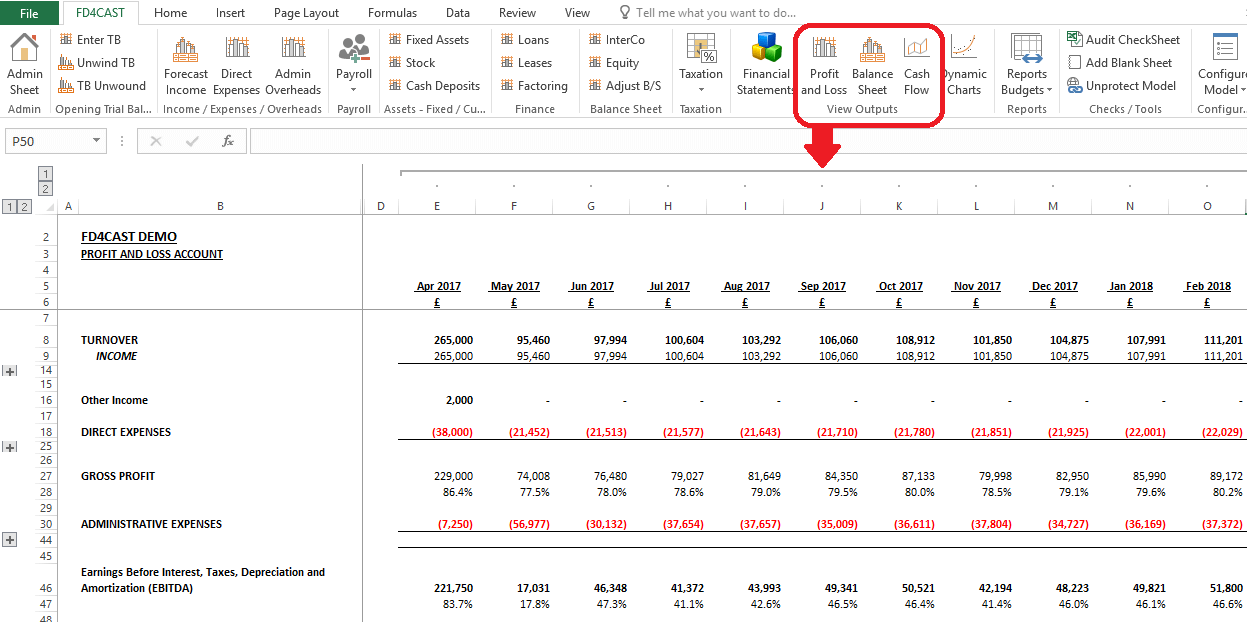
The model calculates the EBITDA (Earnings Before Interest, Taxes, Depreciation and Amortisation) by subtracting total Expenses in row 181 from Gross Profit in row 175. EBIT (Earnings Before Tax and Interest) is calculated by adding EBITDA and Tax Depreciation Charged.
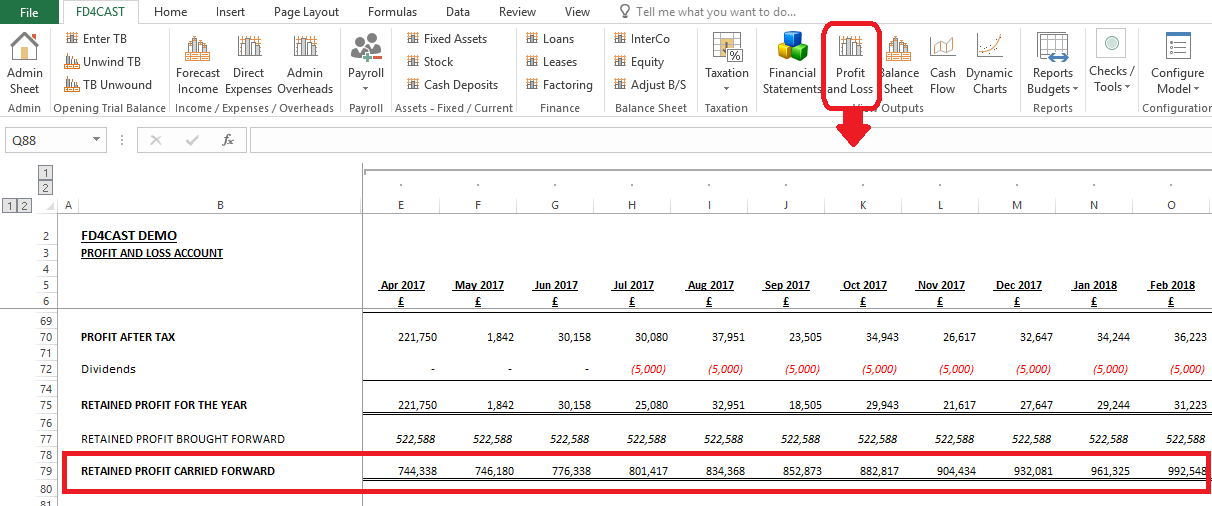
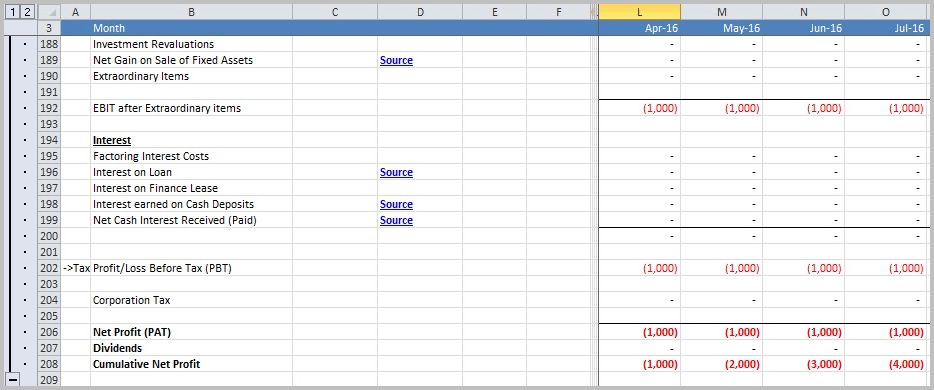
EBIT after Extraordinary Items, Tax Profit/ Loss Before Tax (PBT) Net Profit (PAT) each reflect the -£1,000 prepayment reversal each month.
The Cumulative Net Profit increases each month by -£1,000 until it reaches the end of the prepayment period, in this case it would be March 2017 with a figure of -£12,000 as that is the last month paid for upfront by the insurance period.
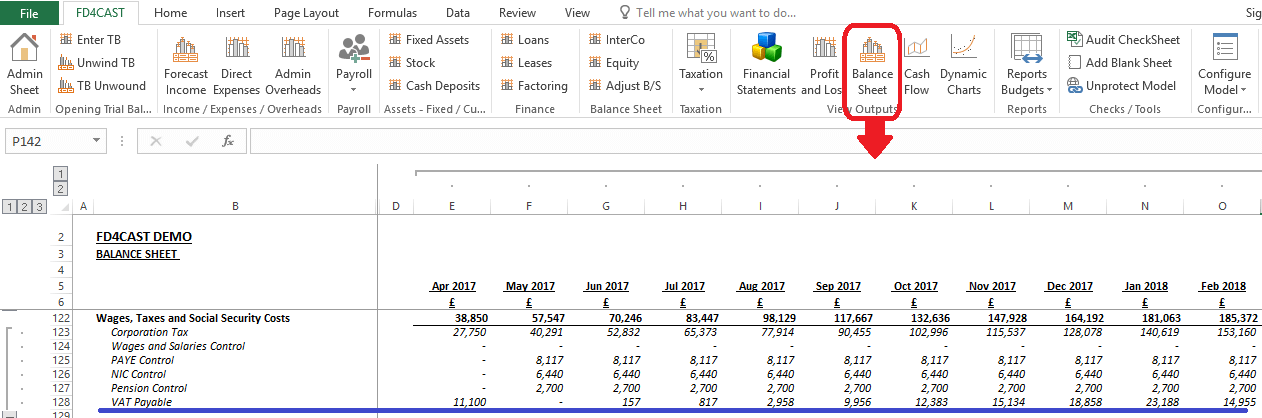
Prepaid Overheads – Impact on Balance Sheet
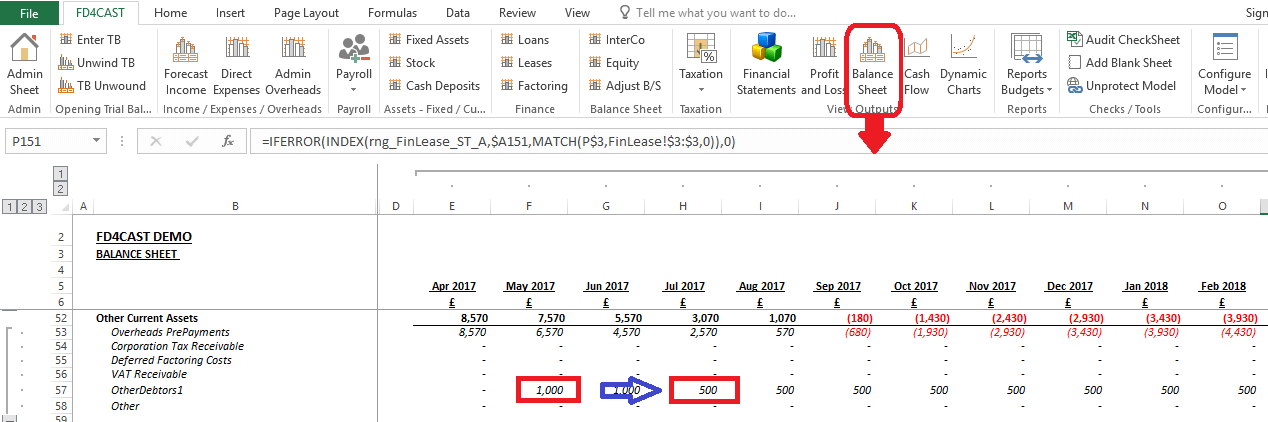
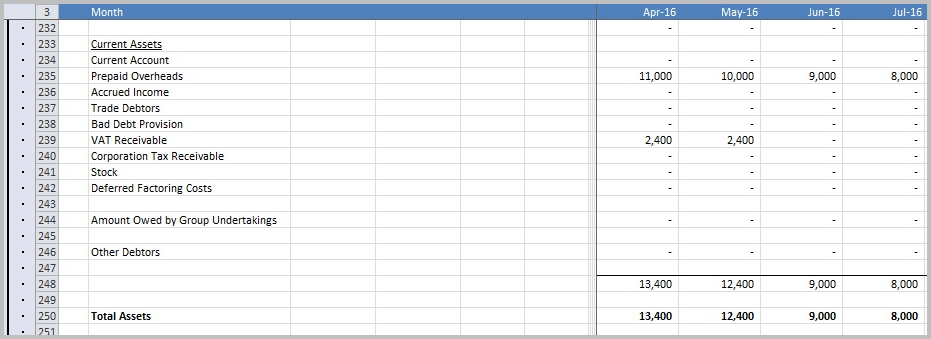
The Insurance Prepaid Overheads is captured under the Company’s Current Assets, and is decreasing by £1,000 per month. The VAT Receivable is also captured as a Current Asset and Total Assets sums all the assets, in this case only Prepaid Overheads and VAT Receivables.
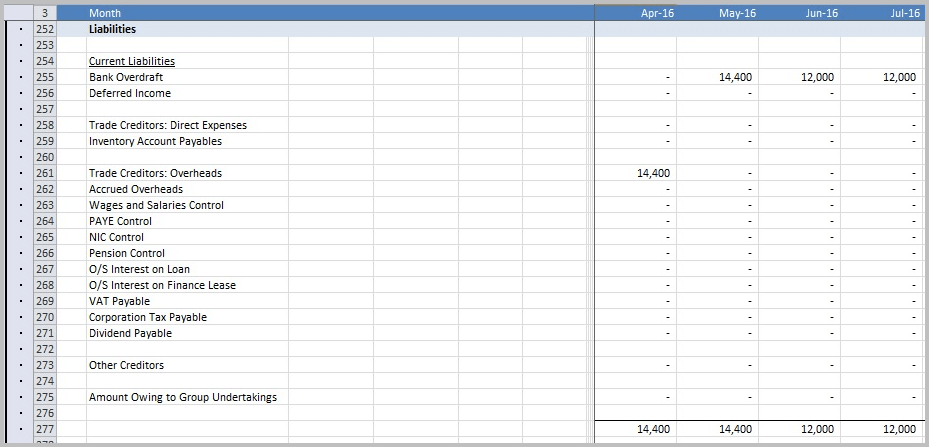
The model calculates the VAT (20% = £2,400) on the £12,000 prepayment for ‘Insurance’ and enters £14,400 in Trade Creditors: Overheads as a Liability of the company in April 2016.
As Insurance has a payment delay of 30 days, Trade Creditors: Overheads reduces to £0 in May 2016, whilst Bank Overdraft increases to show the £14,400 being paid in May 2016. In June 2016 the company’s VAT Refund Receipts receives £2,400, reducing the Bank Overdraft to £12,000.
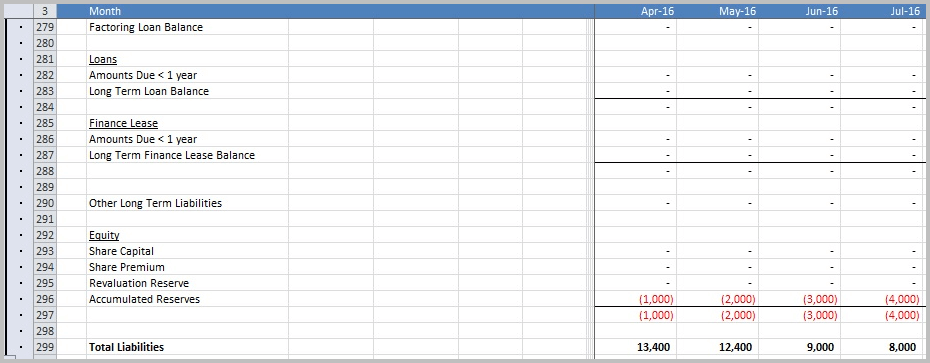
The Accumulated Reserves increases each month by -£1,000 reflecting the prepayment reversal each month.
Total Liabilities sums all of company’s liabilities, in this case for April 2016 £14,400 relating to Trade Creditors: Overheads and -£1,000 Accumulated Reserves. As the Accumulated Reserves increase the company’s Total Liabilities decrease. In this example by March 2017 Accumulated Reserves is -£12,000 and Total Liabilities is £0.
3.3.3 ACCRUED OVERHEADS
When Overheads are paid in arrears, the anticipated costs can be entered over the period that the overhead relates to and then reversed out when the invoice is received.
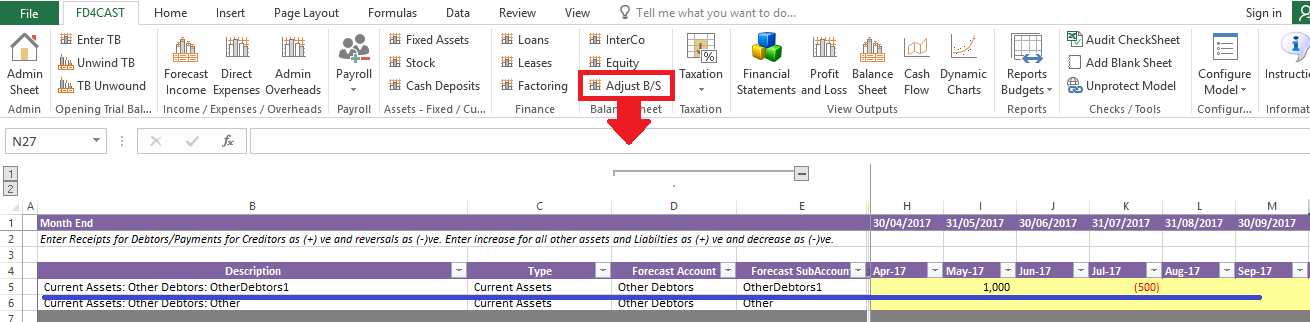
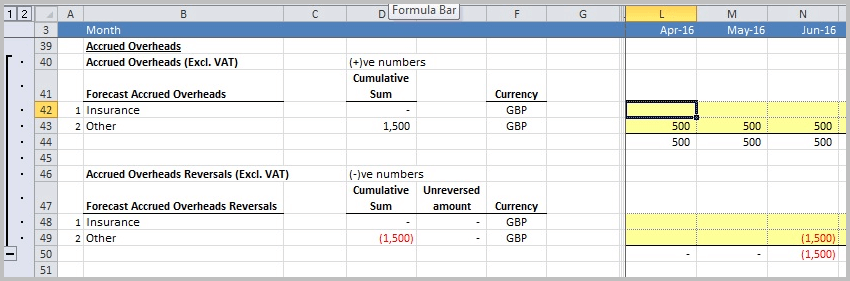
In the example below, ‘Other’ has an accrued overhead of £500 in the months April, May and June 2016. This could relate to the company’s electrical bill that is paid 3 months in arrears. The company knows it has incurred a cost which it estimates will be £1,500 when it receives the invoice from the electricity company. The company can reverse this amount when it receives the invoice in June 2016.
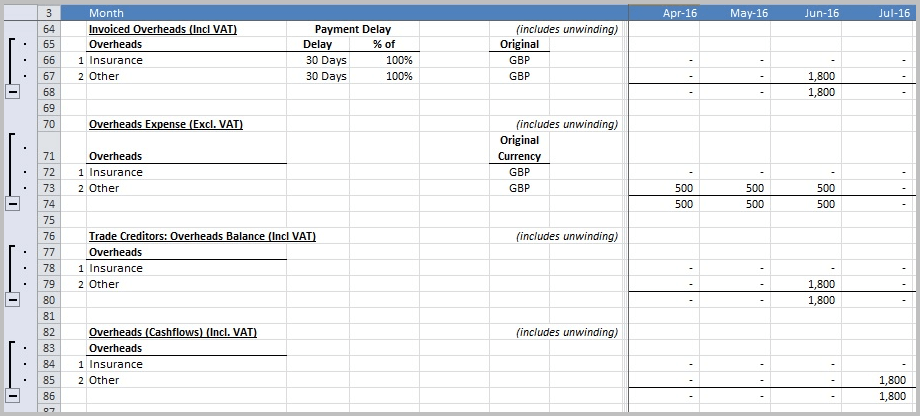
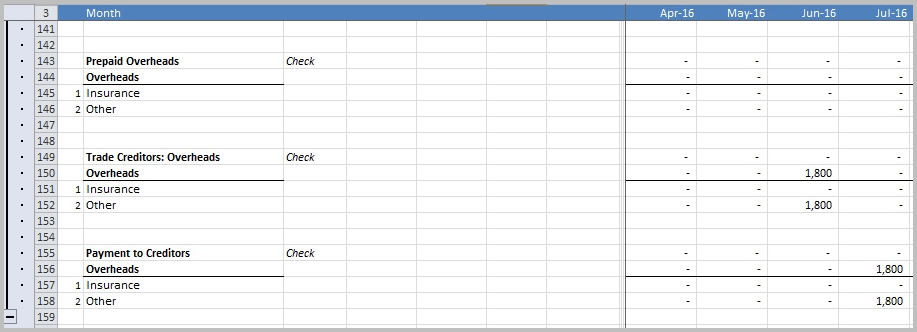
The model calculates the VAT (20% = £300) on the £1,500 invoice and records it in Invoiced Overheads (Incl VAT) and Trade Creditors: Overheads Balance (Incl VAT).
As this overhead is listed as Other, that has a payment delay of 30 days, the model shows the £1,800 being paid in June 2016.
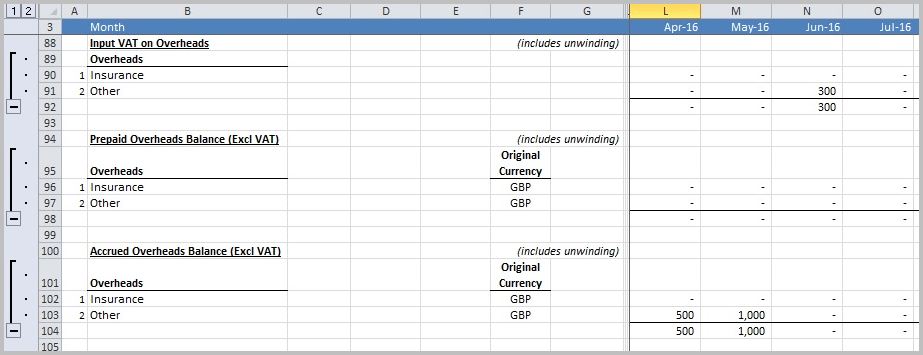
Input VAT on Overheads shows the £300 on the invoice received in June 2016.
The Accrued Overheads Balance (Excl VAT), reflects the accrual of £500 in April and then the accumulation of the April and May accrual resulting in a total of £1,000 in May. In June 2016 the amount is zero as the accrual is reversed.
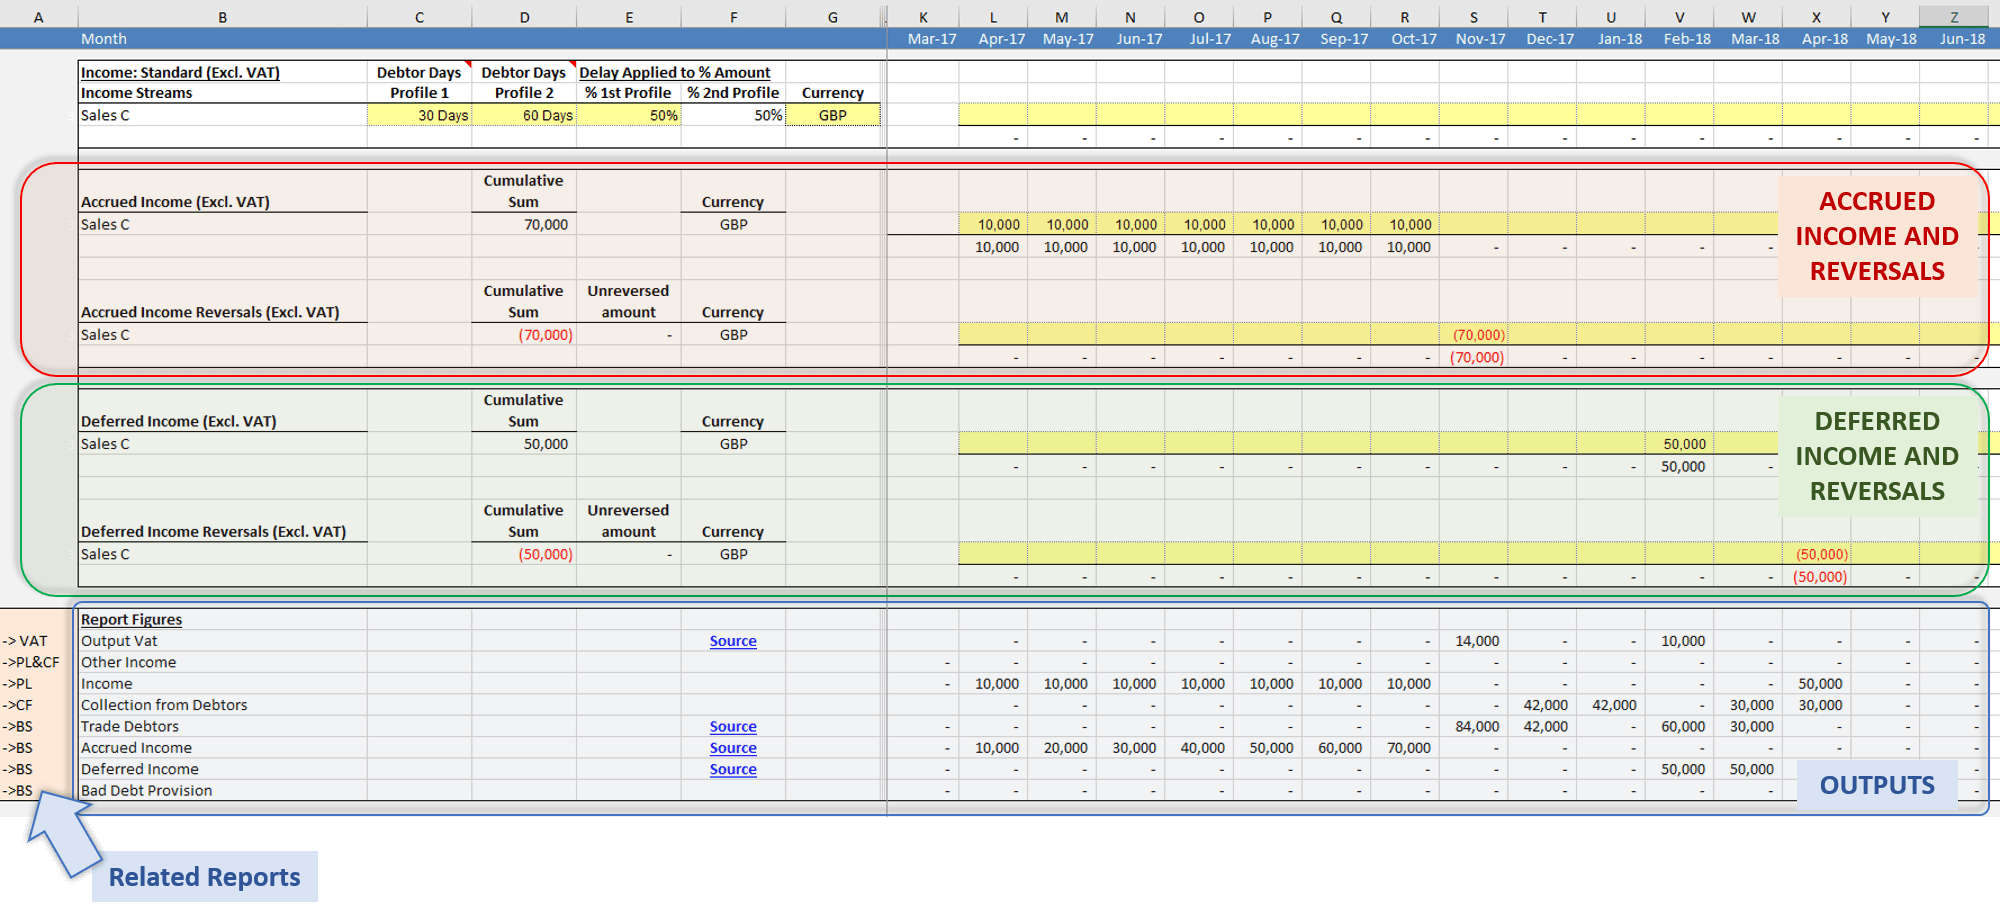
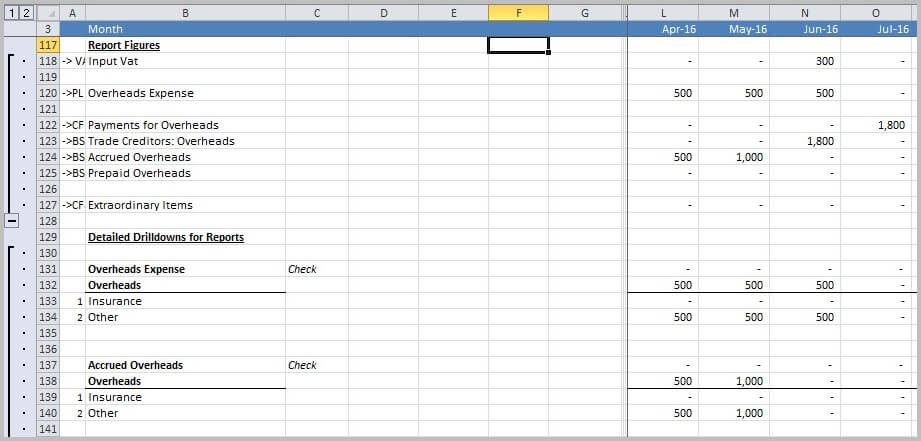
The Report Figures also reflect the figures associated with the accrual.
The Trade Creditors: Overheads shows the £1,800 amount owed to the electrical company in June 2016 and then the Payment to Creditors in July 2016, due to the 30 days payment terms.
Accrued Overheads – Impact on Direct Cash Flow
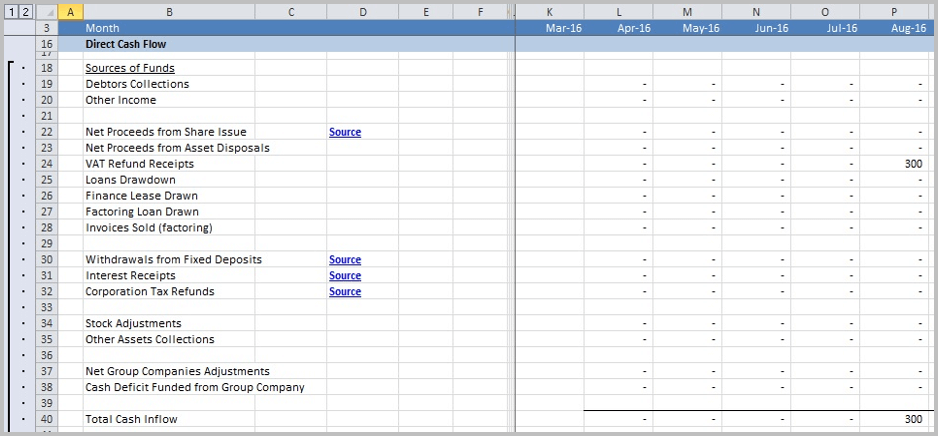
On the Financial Statements worksheet the model reflects the impact on the company’s cash flow. The Total Cash Inflow for Aug 2016 is £300 reflecting the VAT Refund received.
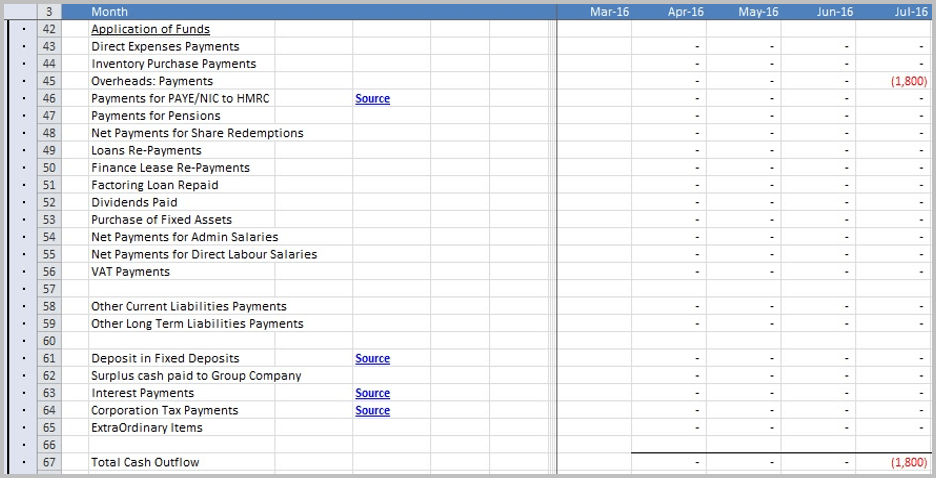
The Total Cash Outflow for Jul 2016 is -£1,800 reflecting the payment of the invoice relating to the electricity cost.
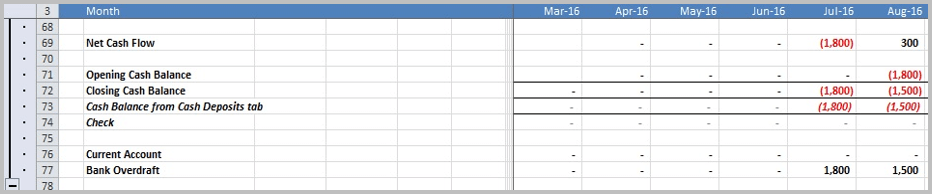
In July 2016 the company’s Opening Cash Balance is £0, the Net Cash flow and Closing Cash Balance are -£1,800, this represents the payment of the invoice. The Bank Overdraft is £1,800.
In August 2016 the company’s Opening Cash Balance is -£1,800, the Net Cash flow is £300 (VAT refund) resulting in a Closing Cash Balance of -£1,500. The Bank Overdraft is now £1,500.
The VAT Refund Receipts means it has a Total Cash Inflow and Net Cash Flow of £2,400. The Opening Cash Balance is £14,400, Closing Cash Balance is £12,000 and Bank Overdraft now £12,000
Accrued Overheads – Impact on Indirect Cash Flow
The accrued overhead -£500 for the 3 months is shown as a negative figure in Profit/Loss Before Tax and Operating cash flow before Working Capital Changes.
The Working Capital Changes shows the VAT receivable of £300 due to be paid in Jun 2016 and then the refund in Aug 2016. It also shows Trade Creditors: Overheads having a balance of £1,800 in June 2016, reflecting the receipt of the invoice and then -£1,800 in July 2016 reflecting the payment of the invoice.
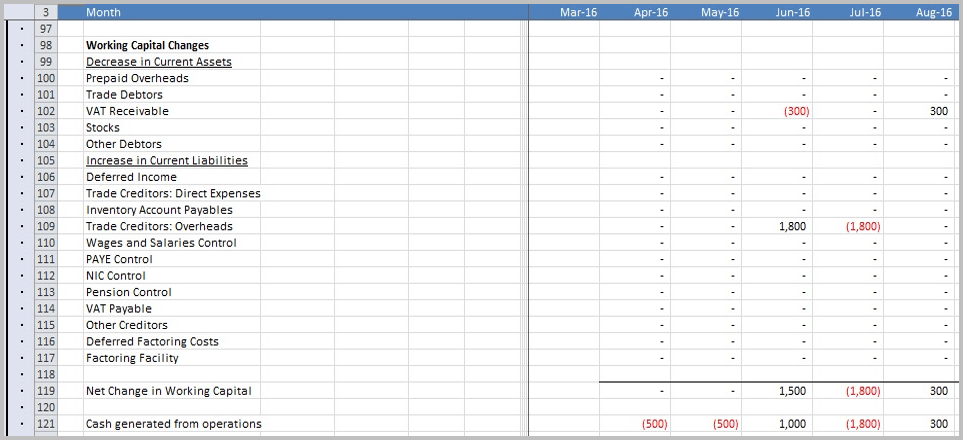
The Net Cashflow from Operating Activities shows the accrual of -£500 in the months April and May 2016. In June 2016 the amount is £1,000, reflecting the -£500 accrual, -£300 VAT Receivable and Trade Creditor: Overheads £1,800. In July 2016 the Net Cashflow from Operating Activities is -£1,800 showing the invoice being paid and in August 2016 £300 showing the refund of the VAT.
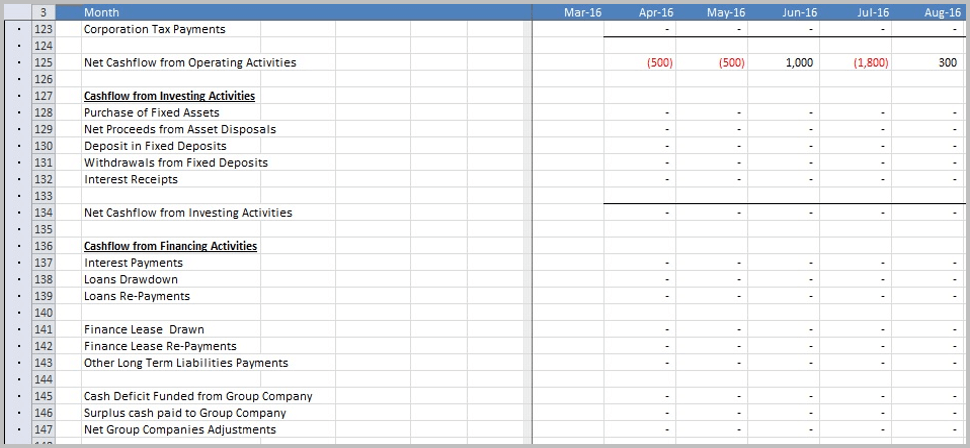
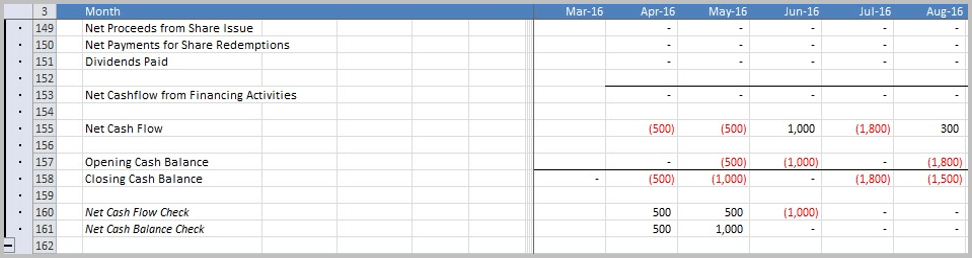
The Net Cashflow reflects the same movements as the Net Cashflow from Operating Activities.
The Opening Cash Balance for April 2016 is £0 with a Closing Cash Balance of -£500, representing the accrual.
In May 2016 the Opening Cash Balance is -£500 and Closing Cash Balance is £1,000, again representing the accrual.
In June 2016 the Opening Cash Balance is -£1,000 with a Closing Cash Balance of £0. This represents the total accrual of -£1,500, VAT Receivable -£300 and Trade Creditors: Overheads of £1,800.
In July the Opening Cash Balance is £0 with a Closing Cash Balance of £1,800, representing the payment of the invoice.
In August the Opening Cash Balance is £1,800 with a Closing Cash Balance of £1,500, representing the £300 refund of the VAT.
Accrued Overheads – Impact on Profit and Loss
The accrued overhead is shown under Expenses over the period that it relates to, in this case £500 over 3 months from April 2016 to June 2016.
The model calculates the EBITDA (Earnings Before Interest, Taxes, Depreciation and Amortisation) by subtracting total Expenses in row 181 from Gross Profit in row 175.
EBIT (Earnings Before Tax and Interest) is calculated by adding EBITDA and Tax Depreciation Charged.
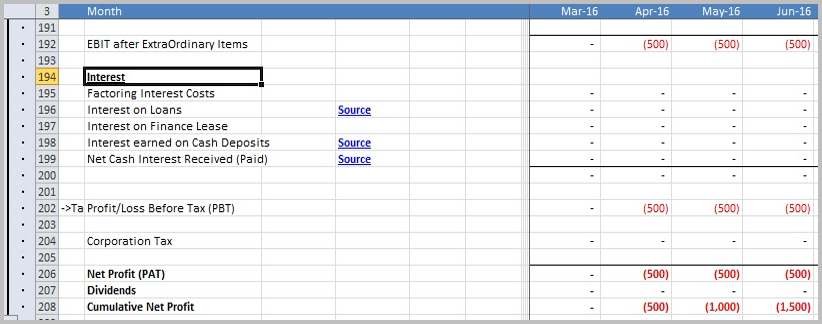
EBIT after Extraordinary Items reflect the £500 accrual each month.
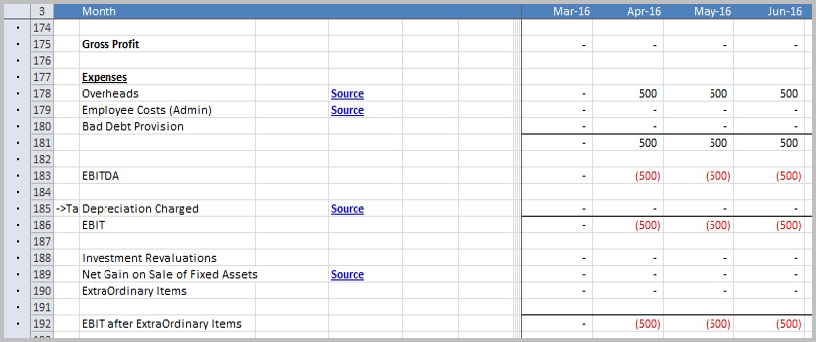
The Cumulative Net Profit increases each month by -£500 until it reaches the end of the accrual period, in this case June 2016 with a figure of -£1,500 as this is the month that the invoice is received.
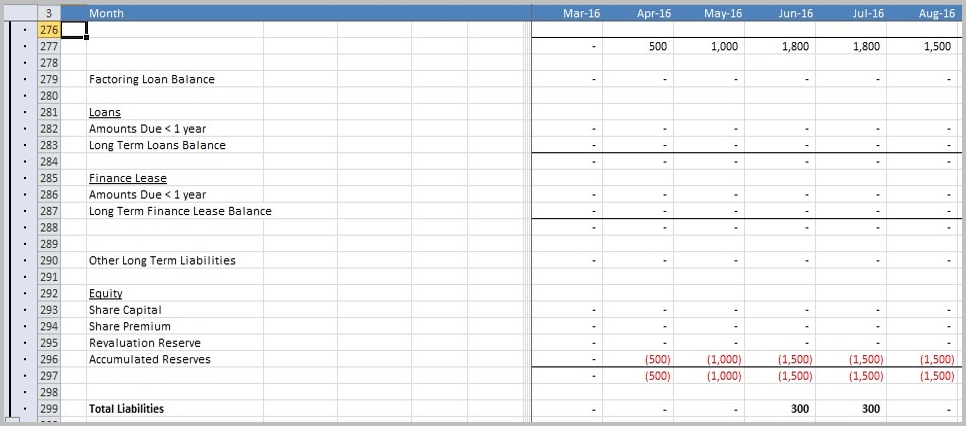
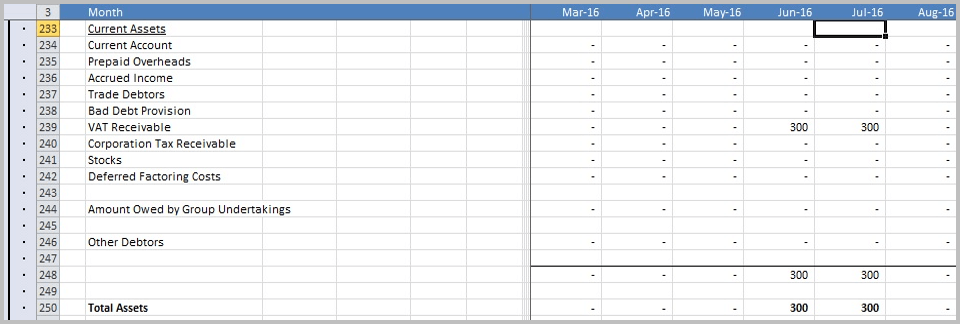
Accrued Overheads – Impact on Balance Sheet
In this example the only impact on the Company’s Total Assets relates to an entry in VAT Receivable for £300 in June 2016 and July 2016. When the VAT refund is received in August it reduces the VAT Receivable to £0.
The model reflects the impact on the Company’s Liabilities, showing the Bank Overdraft of £1,800 in July 2016 and £1,500 in August 2016.
The model also calculates the VAT (20% = £300) on the £1,500 accrual for the Electricity overhead and enters £1,800 in Trade Creditors: Overheads as a Liability of the company in June 2016. The accrual of £500 is reflected in April and the £500 accrual is added to it in May 2016. The accrual for June 2016 is also added, however the accrued overhead reversal is entered in June 2016 resulting in a £0 for June 2016.
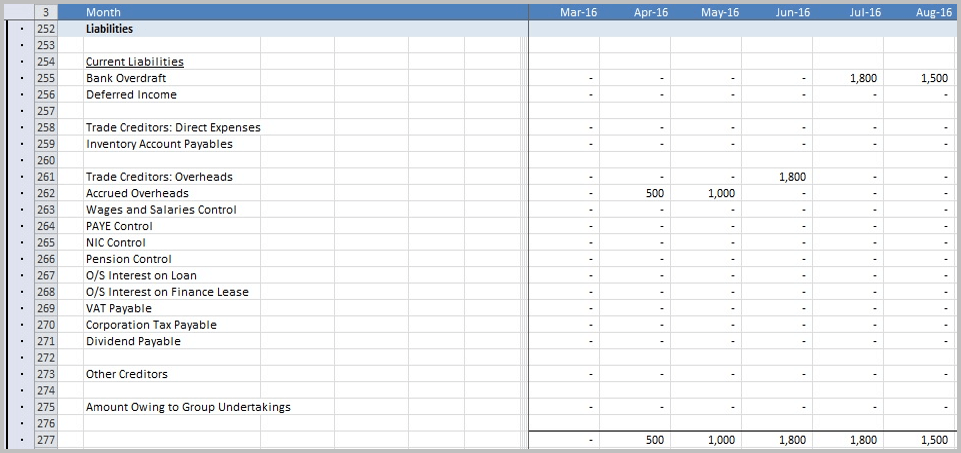
The Accumulated Reserves increases each month by -£500 reflecting the accrued overhead for the electricity cost each month.
Total Liabilities sums all of company’s liabilities, in this case for June 2016 £1,800 relating to Current Liabilities and Accumulated Reserves of -£1,500. When the VAT refund is received in August the Current Liabilities of the Company reduces to £1,500 resulting in Total Liabilities of £0.